7 Авг 2025
1
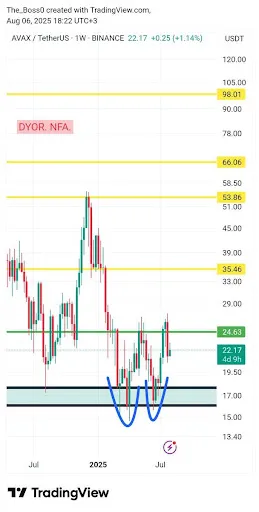
Avalanche сформировал двойное дно, нацелившись на уровень Фибоначчи
Анализ Avalanche (AVAX)
Avalanche (AVAX) демонстрирует признаки возможного разворота тренда. На недельном графике наблюдается формация двойного дна. Основные моменты:
- Формация двойного дна указывает на потенциальный бычий разворот.
- Трейдерам следует следить за зонами сопротивления Фибоначчи для оценки силы ценового движения.
- Существует критический уровень горизонтального сопротивления; закрытие выше этого уровня может стать катализатором дальнейшего роста.
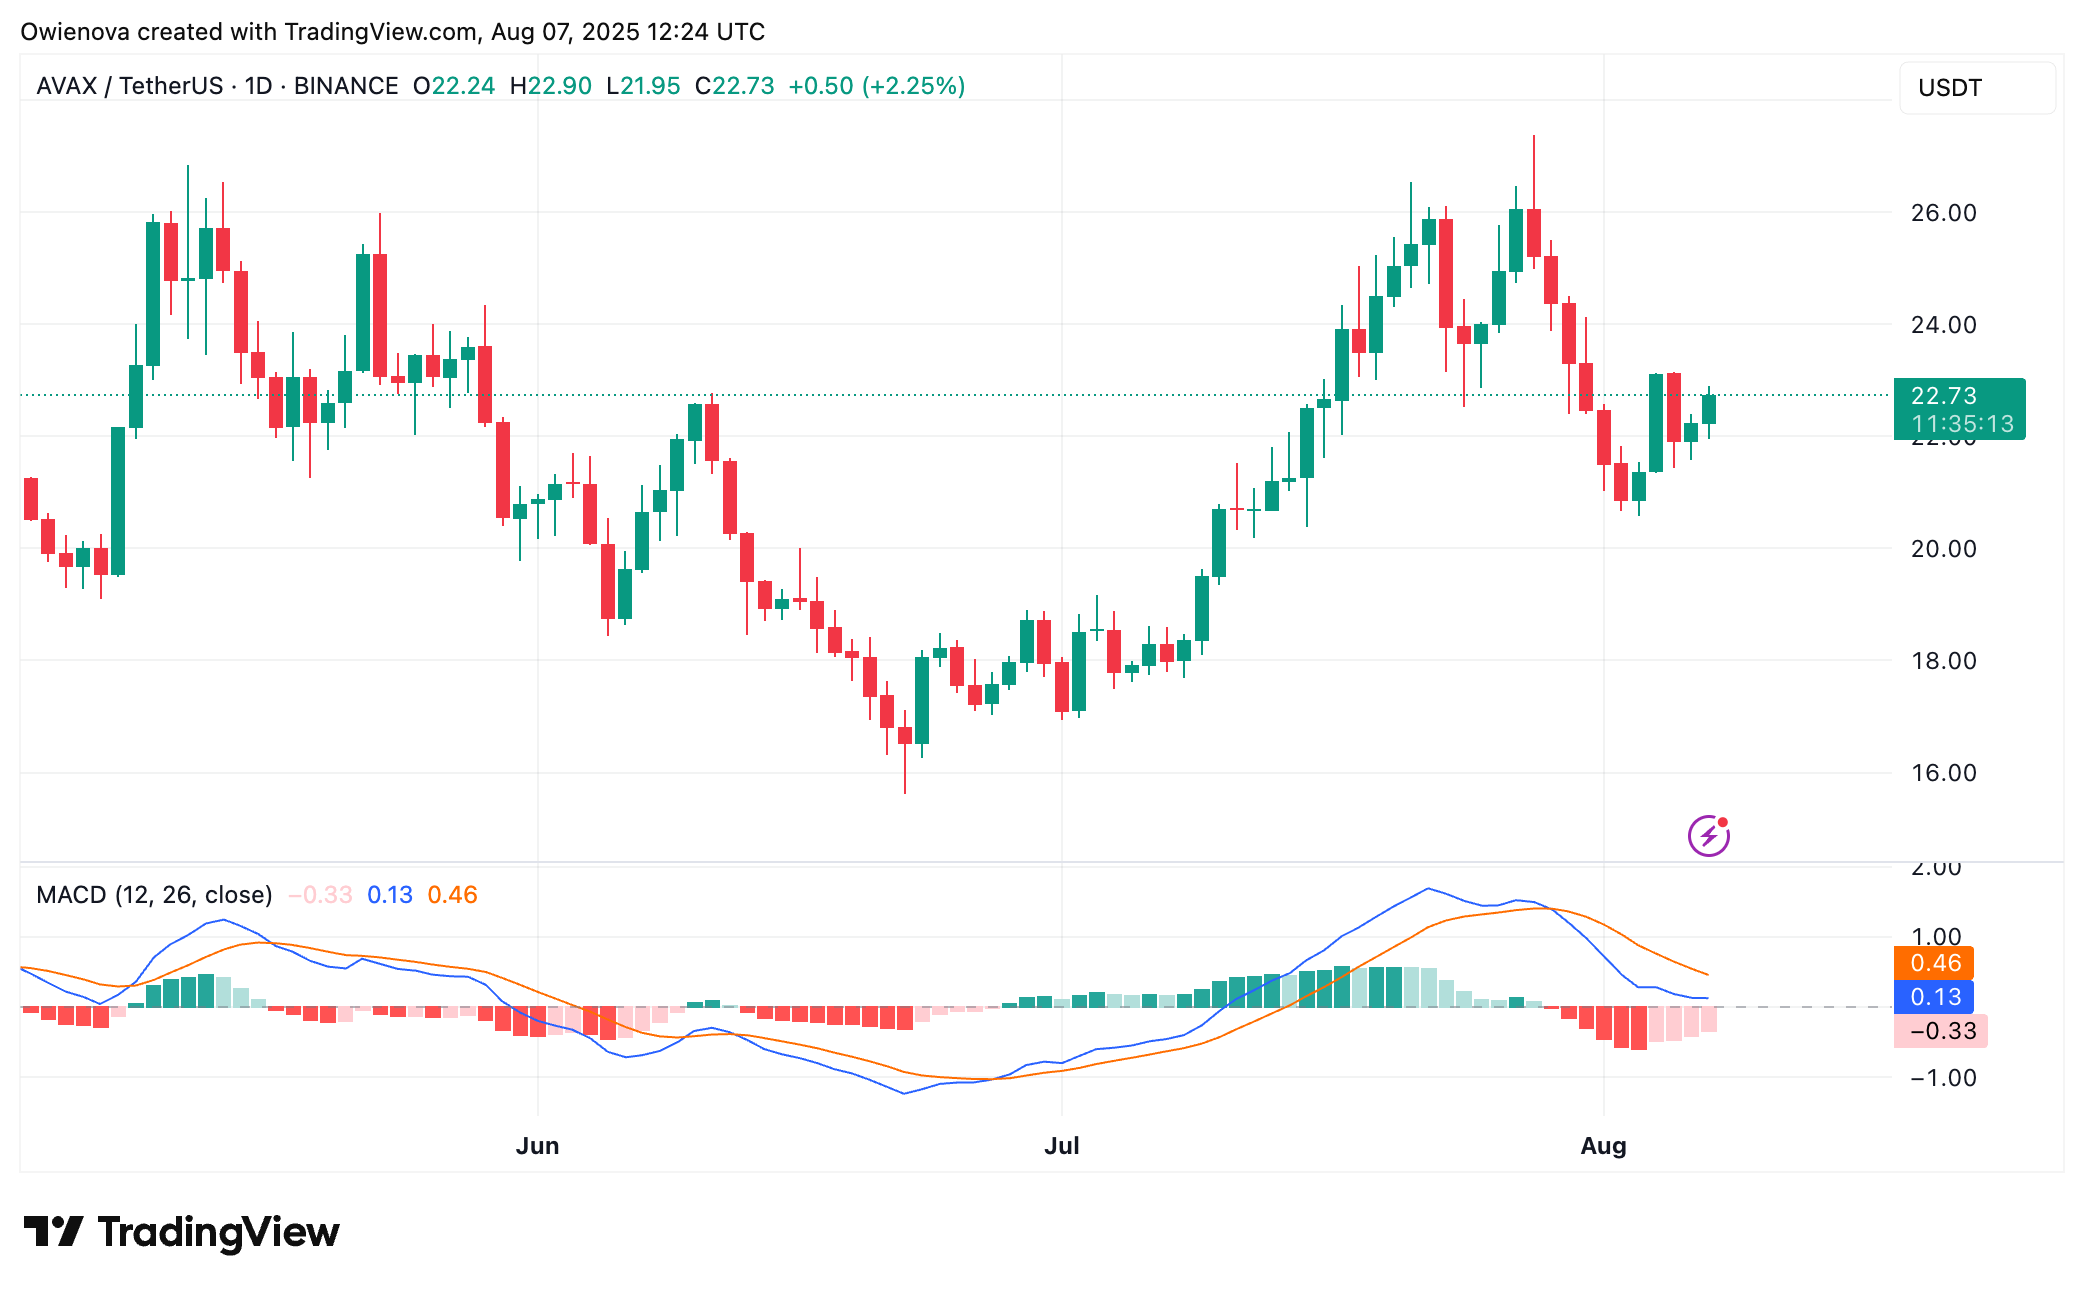
- Индикатор MACD приближается к бычьему пересечению, что свидетельствует о росте покупательского давления.
- Индекс RSI составляет 55, показывая восходящий импульс в пользу быков.
- Индикатор ADX ниже 25, но демонстрирует признаки укрепления; выход выше этого порога может подтвердить определённый восходящий тренд.
- Рост объёма торгов указывает на растущий интерес и уверенность инвесторов.
Несмотря на положительные индикаторы, волатильность остаётся проблемой. Важно поддерживать цены выше ключевых зон сопротивления для сохранения бычьего импульса. Рекомендуется внимательно следить за подтверждениями индикаторов и недельными закрытиями.