

10 0
Avalanche Forms Double Bottom Pattern, Targets Key Fibonacci Resistance Zone

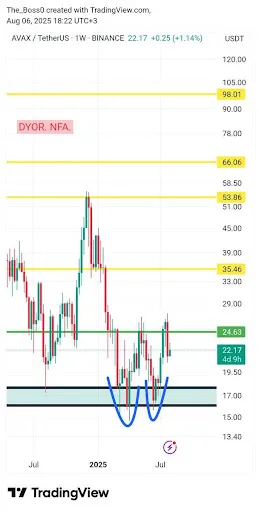
Avalanche (AVAX) is displaying signs of a potential trend reversal, characterized by a double bottom pattern on the weekly chart. Key points include:
- The double bottom formation suggests a possible bullish reversal.
- Traders should monitor Fibonacci resistance zones for price action strength.
- A critical horizontal resistance level exists, with a strong weekly close above it likely acting as a catalyst for further gains.
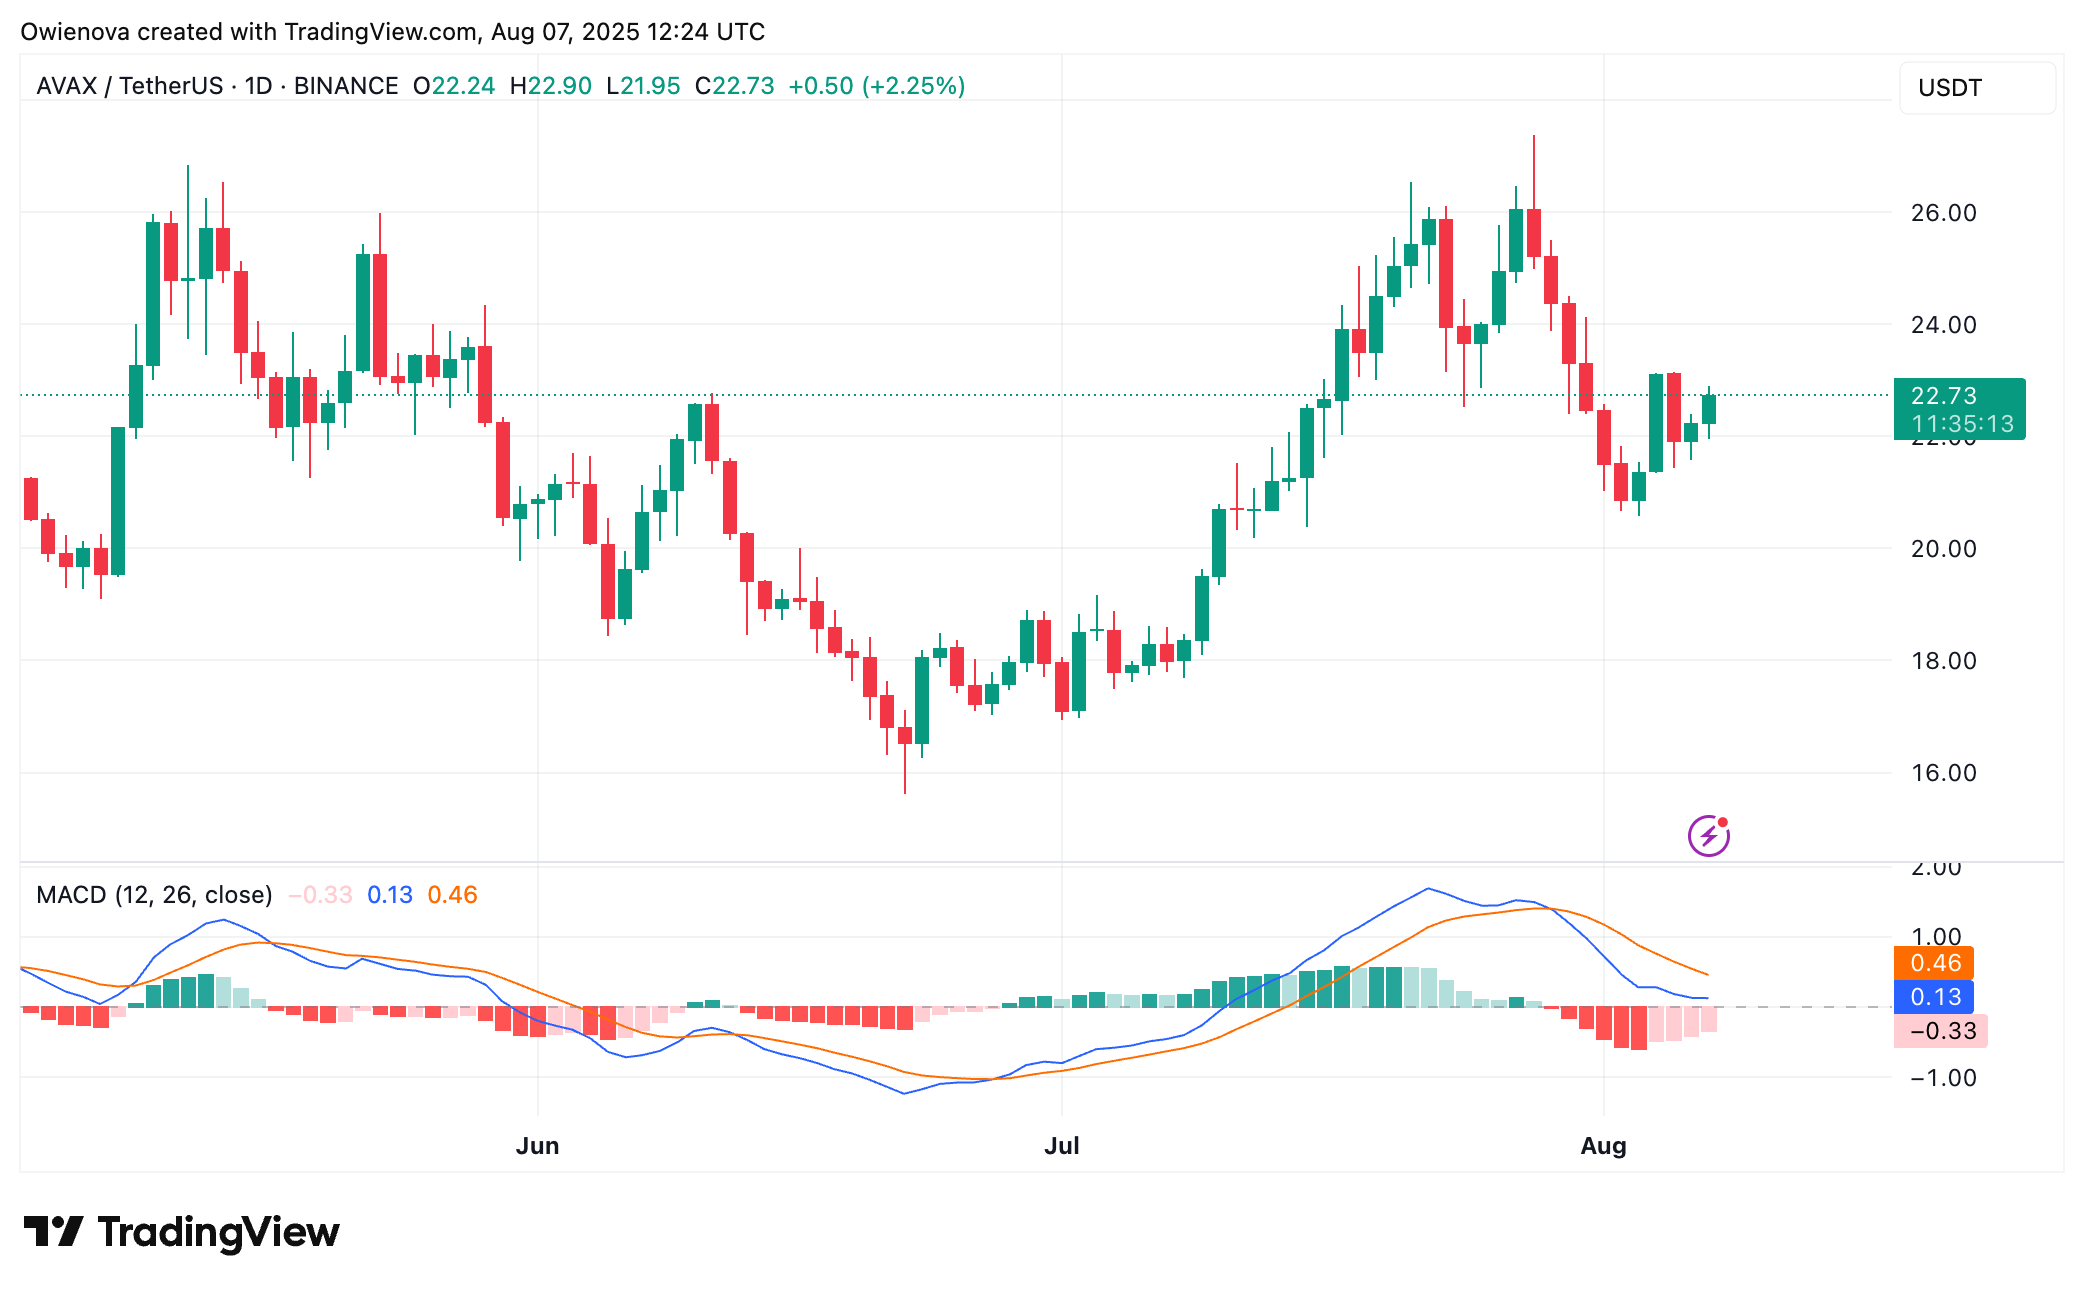
- The MACD indicator is nearing a bullish crossover, indicating rising buying pressure.
- The RSI is at 55, showing upward momentum favoring bulls.
- The ADX is below 25 but shows signs of strengthening; crossing above this threshold could confirm a defined upward trend.
- An increase in trading volume indicates growing investor interest and confidence.
Despite the positive indicators, volatility remains a concern, and maintaining prices above key resistance zones is essential for sustaining bullish momentum. Close attention to indicator confirmations and weekly closes is advised.
Authors credited by the source: Godspower Owie
Published by Holder based on an external source.