Sep 19, 2025
5 0
Analyst Predicts 78% Price Move for PEPE Amid Triangle Formation
An analyst predicts a potential 78% price move for Pepe based on a Symmetrical Triangle pattern in its daily chart.
Key Points:
- The Symmetrical Triangle forms when an asset consolidates between two converging trendlines.
- The upper line acts as resistance, while the lower provides support, confining the price within a narrowing range.
- A breakout from this pattern can indicate a strong directional move, either bullish or bearish.
- Pepe's price has been confined within this triangle since December and is nearing the apex, suggesting a breakout could occur soon.
- If a breakout happens, the expected move may be up to 78%, based on the triangle's base length.

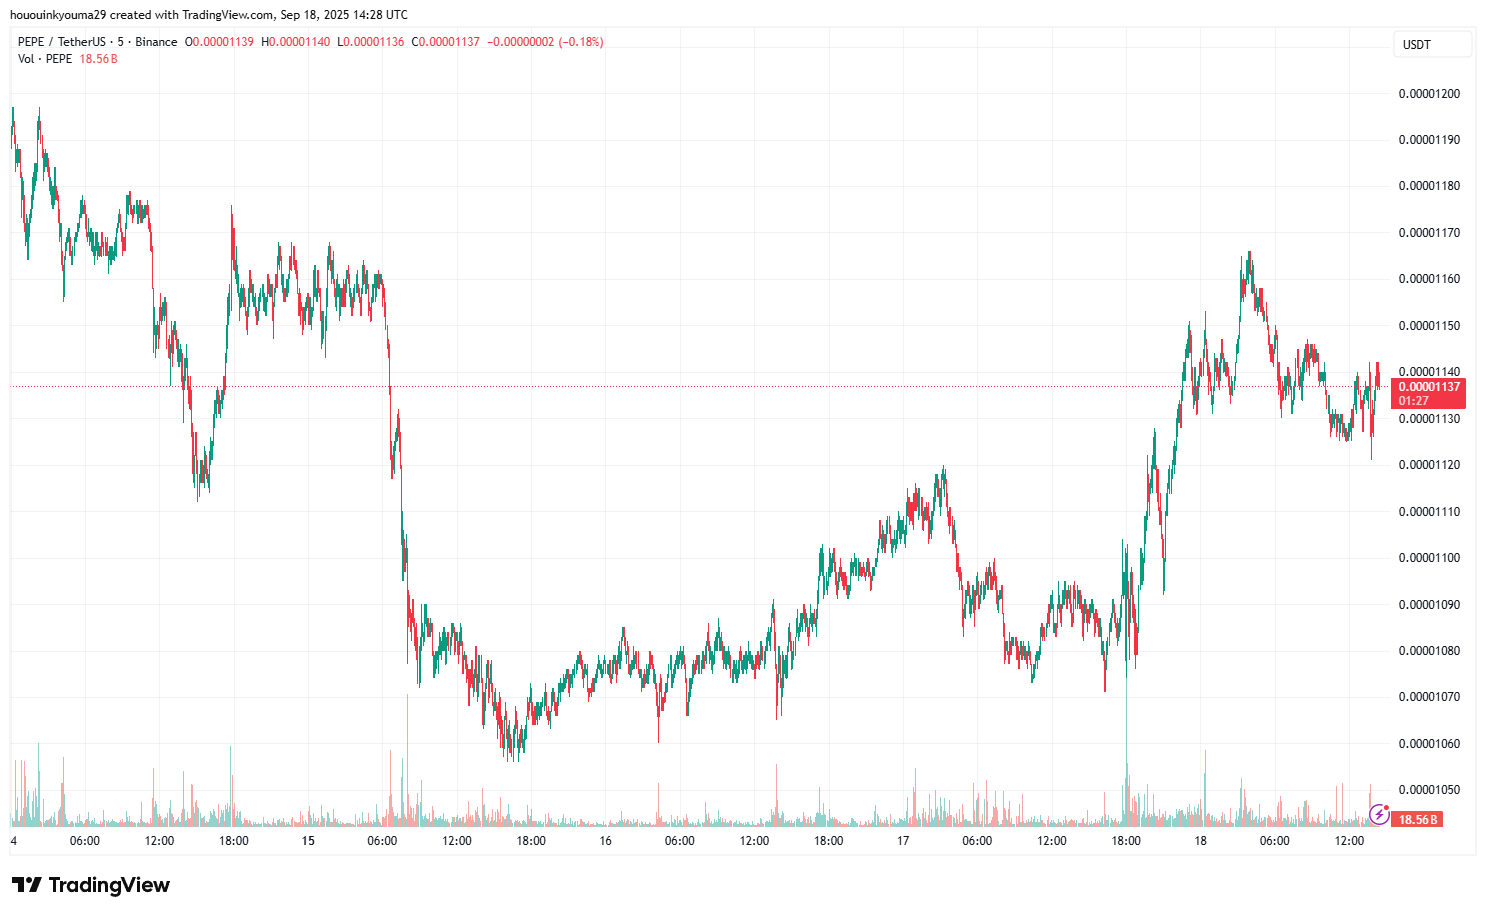
Currently, Pepe is trading at $0.00001137, with a 9% increase over the past week.