Feb 22, 2026
3 0
BEARISH 📉 : Ethereum maintains downtrend despite inverted chart optimism
Ethereum is currently showing strength, yet remains in a downtrend until key resistance levels are reclaimed. An inverted chart suggests potential bullish patterns, though optimism is conditional.
Key Observations on Ethereum's HTF Structure
- Mizer has been short on Ethereum, focusing on lower time frame (LTF) opportunities due to macro uncertainties.
- The higher time frame (HTF) structure indicates a distribution phase followed by consistent breakdowns since the $5,000 peak.
- A parabolic curve from the $5,000 top is a significant pattern, maintaining the downtrend unless decisively broken.
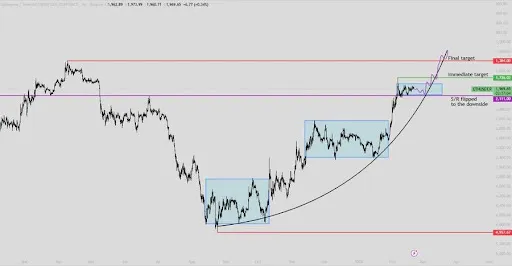
A strong impulse move into a crucial support/resistance zone was highlighted, which is now functioning as support on the inverted chart. Current consolidation is being monitored for further price action.
Possible Scenarios from Current Consolidation
- Continuation after a shallow pullback or a brief fake breakdown followed by a swift reclaim could lead to further downside for ETH.
- The "ideal" bullish scenario involves the price respecting the parabolic curve, keeping the bearish trajectory as the base case.
Short-term targets around $1,700 are seen as logical areas for profit-taking, with the potential to challenge the parabolic resistance. The final target lies near $1,400 if momentum fully develops. However, losing the key flip zone would invalidate this setup and possibly signal a trend reversal.