Bitcoin Analysts Warn of Potential Drop to $80,000 Due to Patterns
Bitcoin (BTC) is currently trading between $90,000 and $100,000. Some analysts forecast a potential price correction due to a bearish ‘head and shoulders’ pattern on the daily chart.
Bitcoin To Drop To $80,000?
Analyst Aksel Kibar noted a potential head and shoulders pattern in his analysis, suggesting BTC could drop to $80,000 if the pattern fully materializes. He indicated that a significant pullback would require a breach below the neckline of this pattern:
Seeing it is not enough. It needs to materialize with a breach below the neckline. There are many cases of failed head and shoulders tops especially in steady uptrends well above the year-long average.
Other analysts share a similar bearish outlook. Technical analyst Ali Martinez identified $92,730 as a critical support level; losing this could lead BTC into "free fall territory," based on UTXO Realized Price Distribution (URPD).
URPD reflects the distribution of Bitcoin’s Unspent Transaction Outputs across various price levels, revealing areas of significant accumulation or spending.
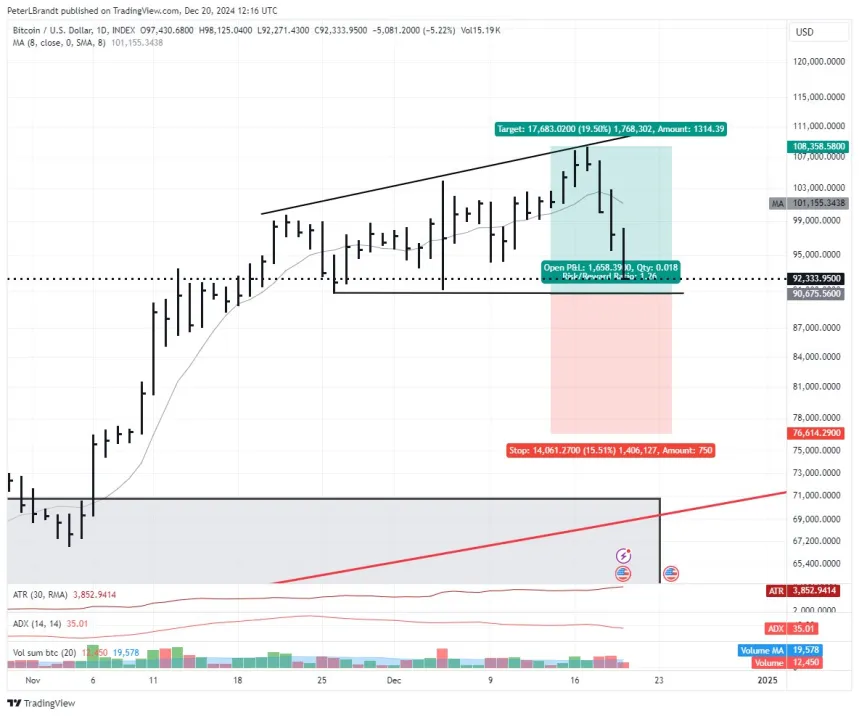
Tone Vays expressed concern that trading below $95,000 would be detrimental for BTC, while trader Peter Brandt pointed out risks associated with a breakdown from a ‘broadening triangle’ formation, which may see BTC fall to $70,000.
Despite these predictions, some remain bullish on Bitcoin's long-term prospects. Thomas Lee of Fundstrat Capital projected BTC could reach $250,000 by 2025, though he acknowledged a possible correction to $60,000 early next year before a bull run.
The Long-Term Bullish Case For BTC
While the short-term outlook appears uncertain, long-term projections are optimistic. Sygnum reports potential 'demand shocks' driven by institutional interest, which could significantly increase BTC's price.
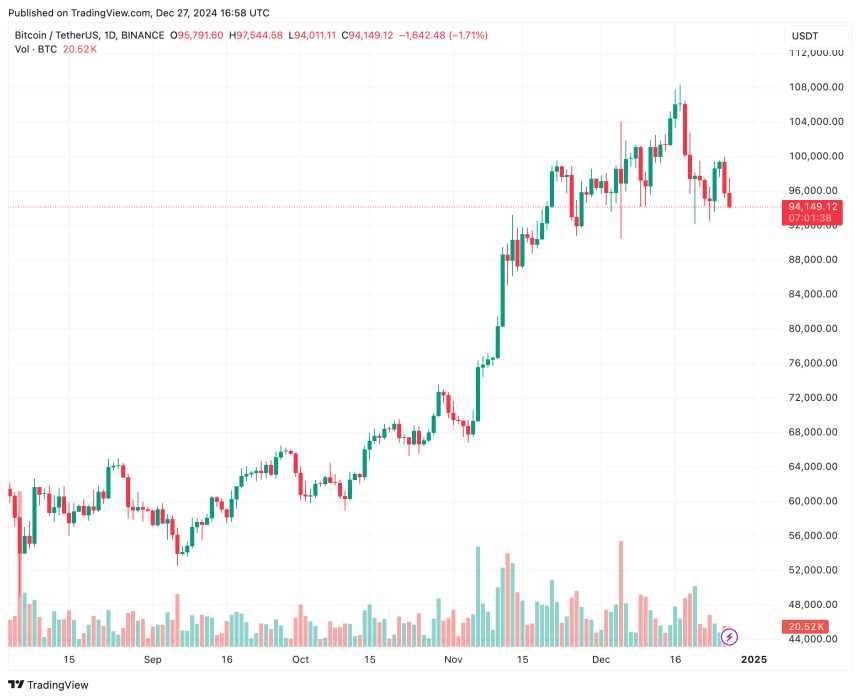
Ali Martinez also noted a potential ‘cup and handle’ pattern forming, which could signal renewed bullish momentum for BTC. As of now, BTC trades at $94,149, down 2.5% in the last 24 hours.