Bitcoin Forms Daily Death Cross on Dominance Chart for First Time in Four Years
Recent trends in the crypto market over the past four days indicate a resurgence of bullish momentum, particularly led by Bitcoin. This shift has prompted projections of potential gains in various altcoins, suggesting an approaching altcoin season.
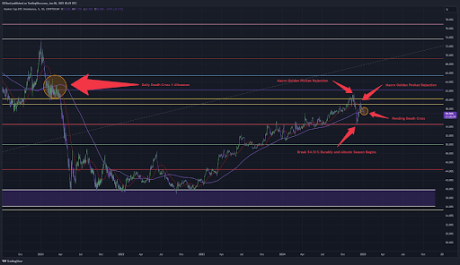
Bitcoin Dominance Chart Forms Daily Death Cross
Technical analysis reveals that Bitcoin's dominance chart is nearing a daily death cross. A death cross occurs when a short-term moving average falls below a long-term moving average, often indicating bearish momentum. The dominance chart measures Bitcoin's market cap as a percentage of the total cryptocurrency market cap; a decline suggests strengthening altcoins.
This particular daily death cross is forming at a macro high for the first time in four years. Kevin’s analysis notes that Bitcoin dominance has faced two macro golden pocket rejections in the past three months, signaling a potential shift in market dynamics if the death cross materializes.
What Does This Mean For Cryptocurrencies?
Kevin's analysis references a historical instance where a daily death cross at a macro high preceded an altcoin season. In 2021, a similar occurrence on the Bitcoin dominance chart marked a shift in market focus from Bitcoin to altcoins, with Bitcoin's dominance dropping from around 63% to below 40% by April 2021.
The current setup suggests a comparable scenario could unfold. If the death cross results in a sustained decline in Bitcoin dominance, it may trigger an altcoin market rally.
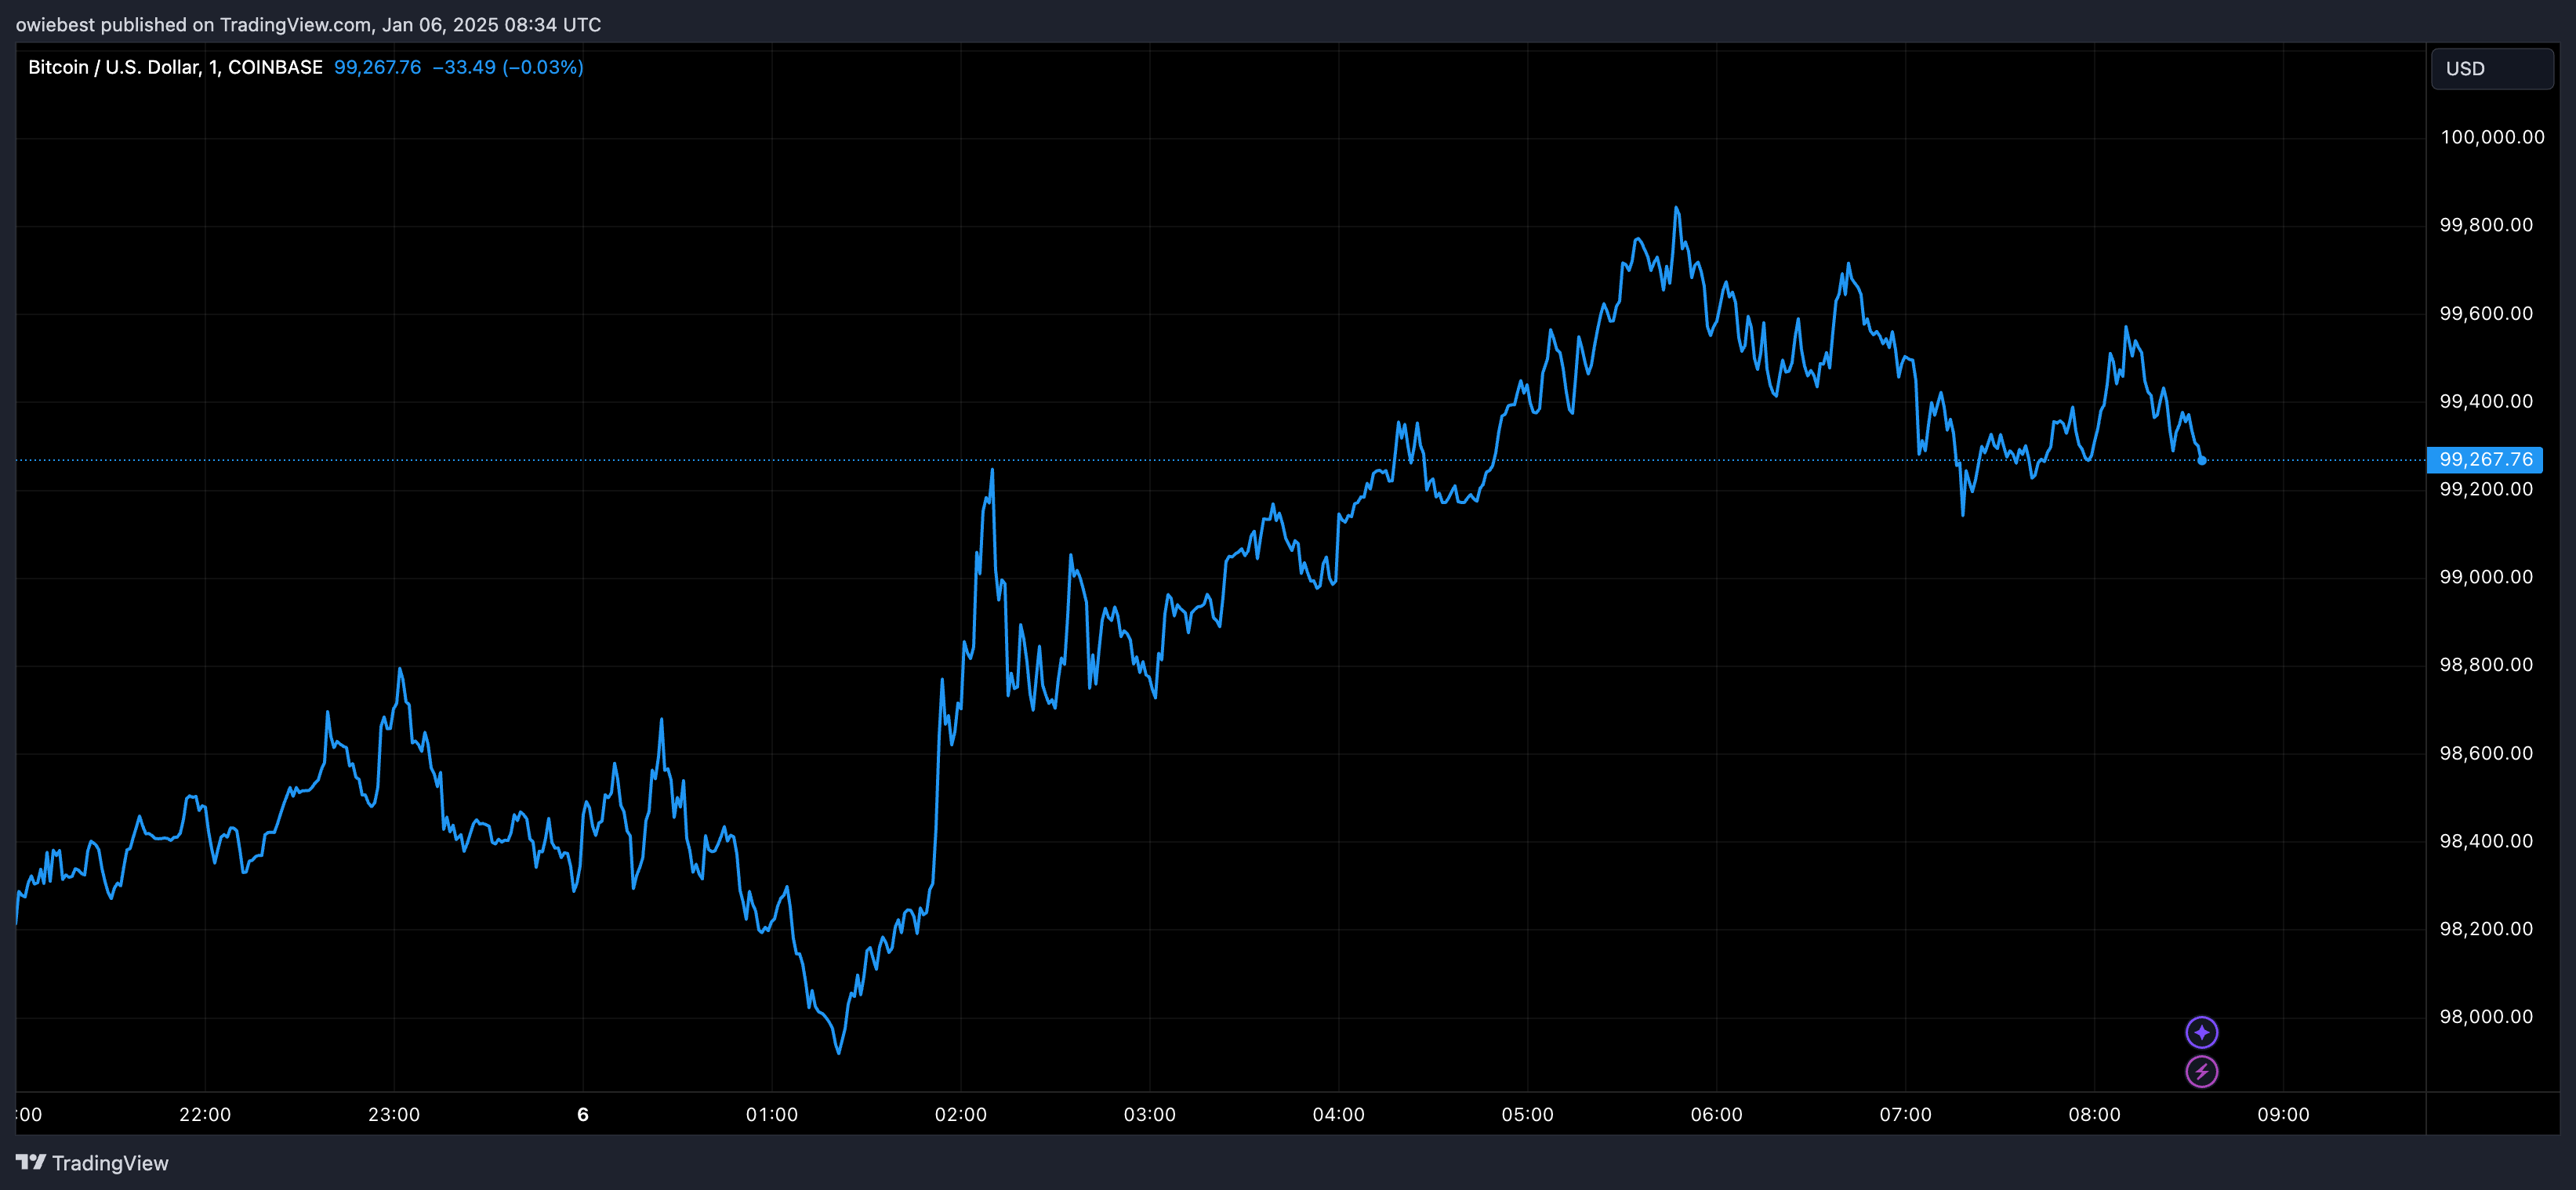
Currently, Bitcoin maintains a dominant position with a trading price of $99,750 and a 55.8% market dominance. However, cryptocurrencies like XRP, Dogecoin, and Solana are beginning to challenge this dominance. Ethereum, while significant among altcoins, has not yet demonstrated a substantial rally this cycle.
Additionally, analyst TechDev highlights the potential beginning of an altseason, focusing on the six-month candlestick timeframe of the Bitcoin dominance chart. He notes that the current candlestick aligns with previous periods when altcoins rallied, drawing parallels to the cycles of 2017 and 2021, where Bitcoin dominance fell after exceeding prior all-time highs.