Sep 23, 2025
19 3
Bitcoin Drops Below $113,000 as TD Sequential Signals Buy
Bitcoin has dropped below $113,000, but a technical indicator suggests a potential buying opportunity.
TD Sequential Buy Signal
- The Tom Demark (TD) Sequential indicator has given a buy signal for Bitcoin on its 4-hour price chart.
- This indicator identifies potential reversal points in an asset's price through two phases: setup and countdown.
- The setup involves counting nine consecutive candles of the same color; a buy signal is indicated after nine red candles.
- Bitcoin recently completed this setup, suggesting it may have reached a bottom.
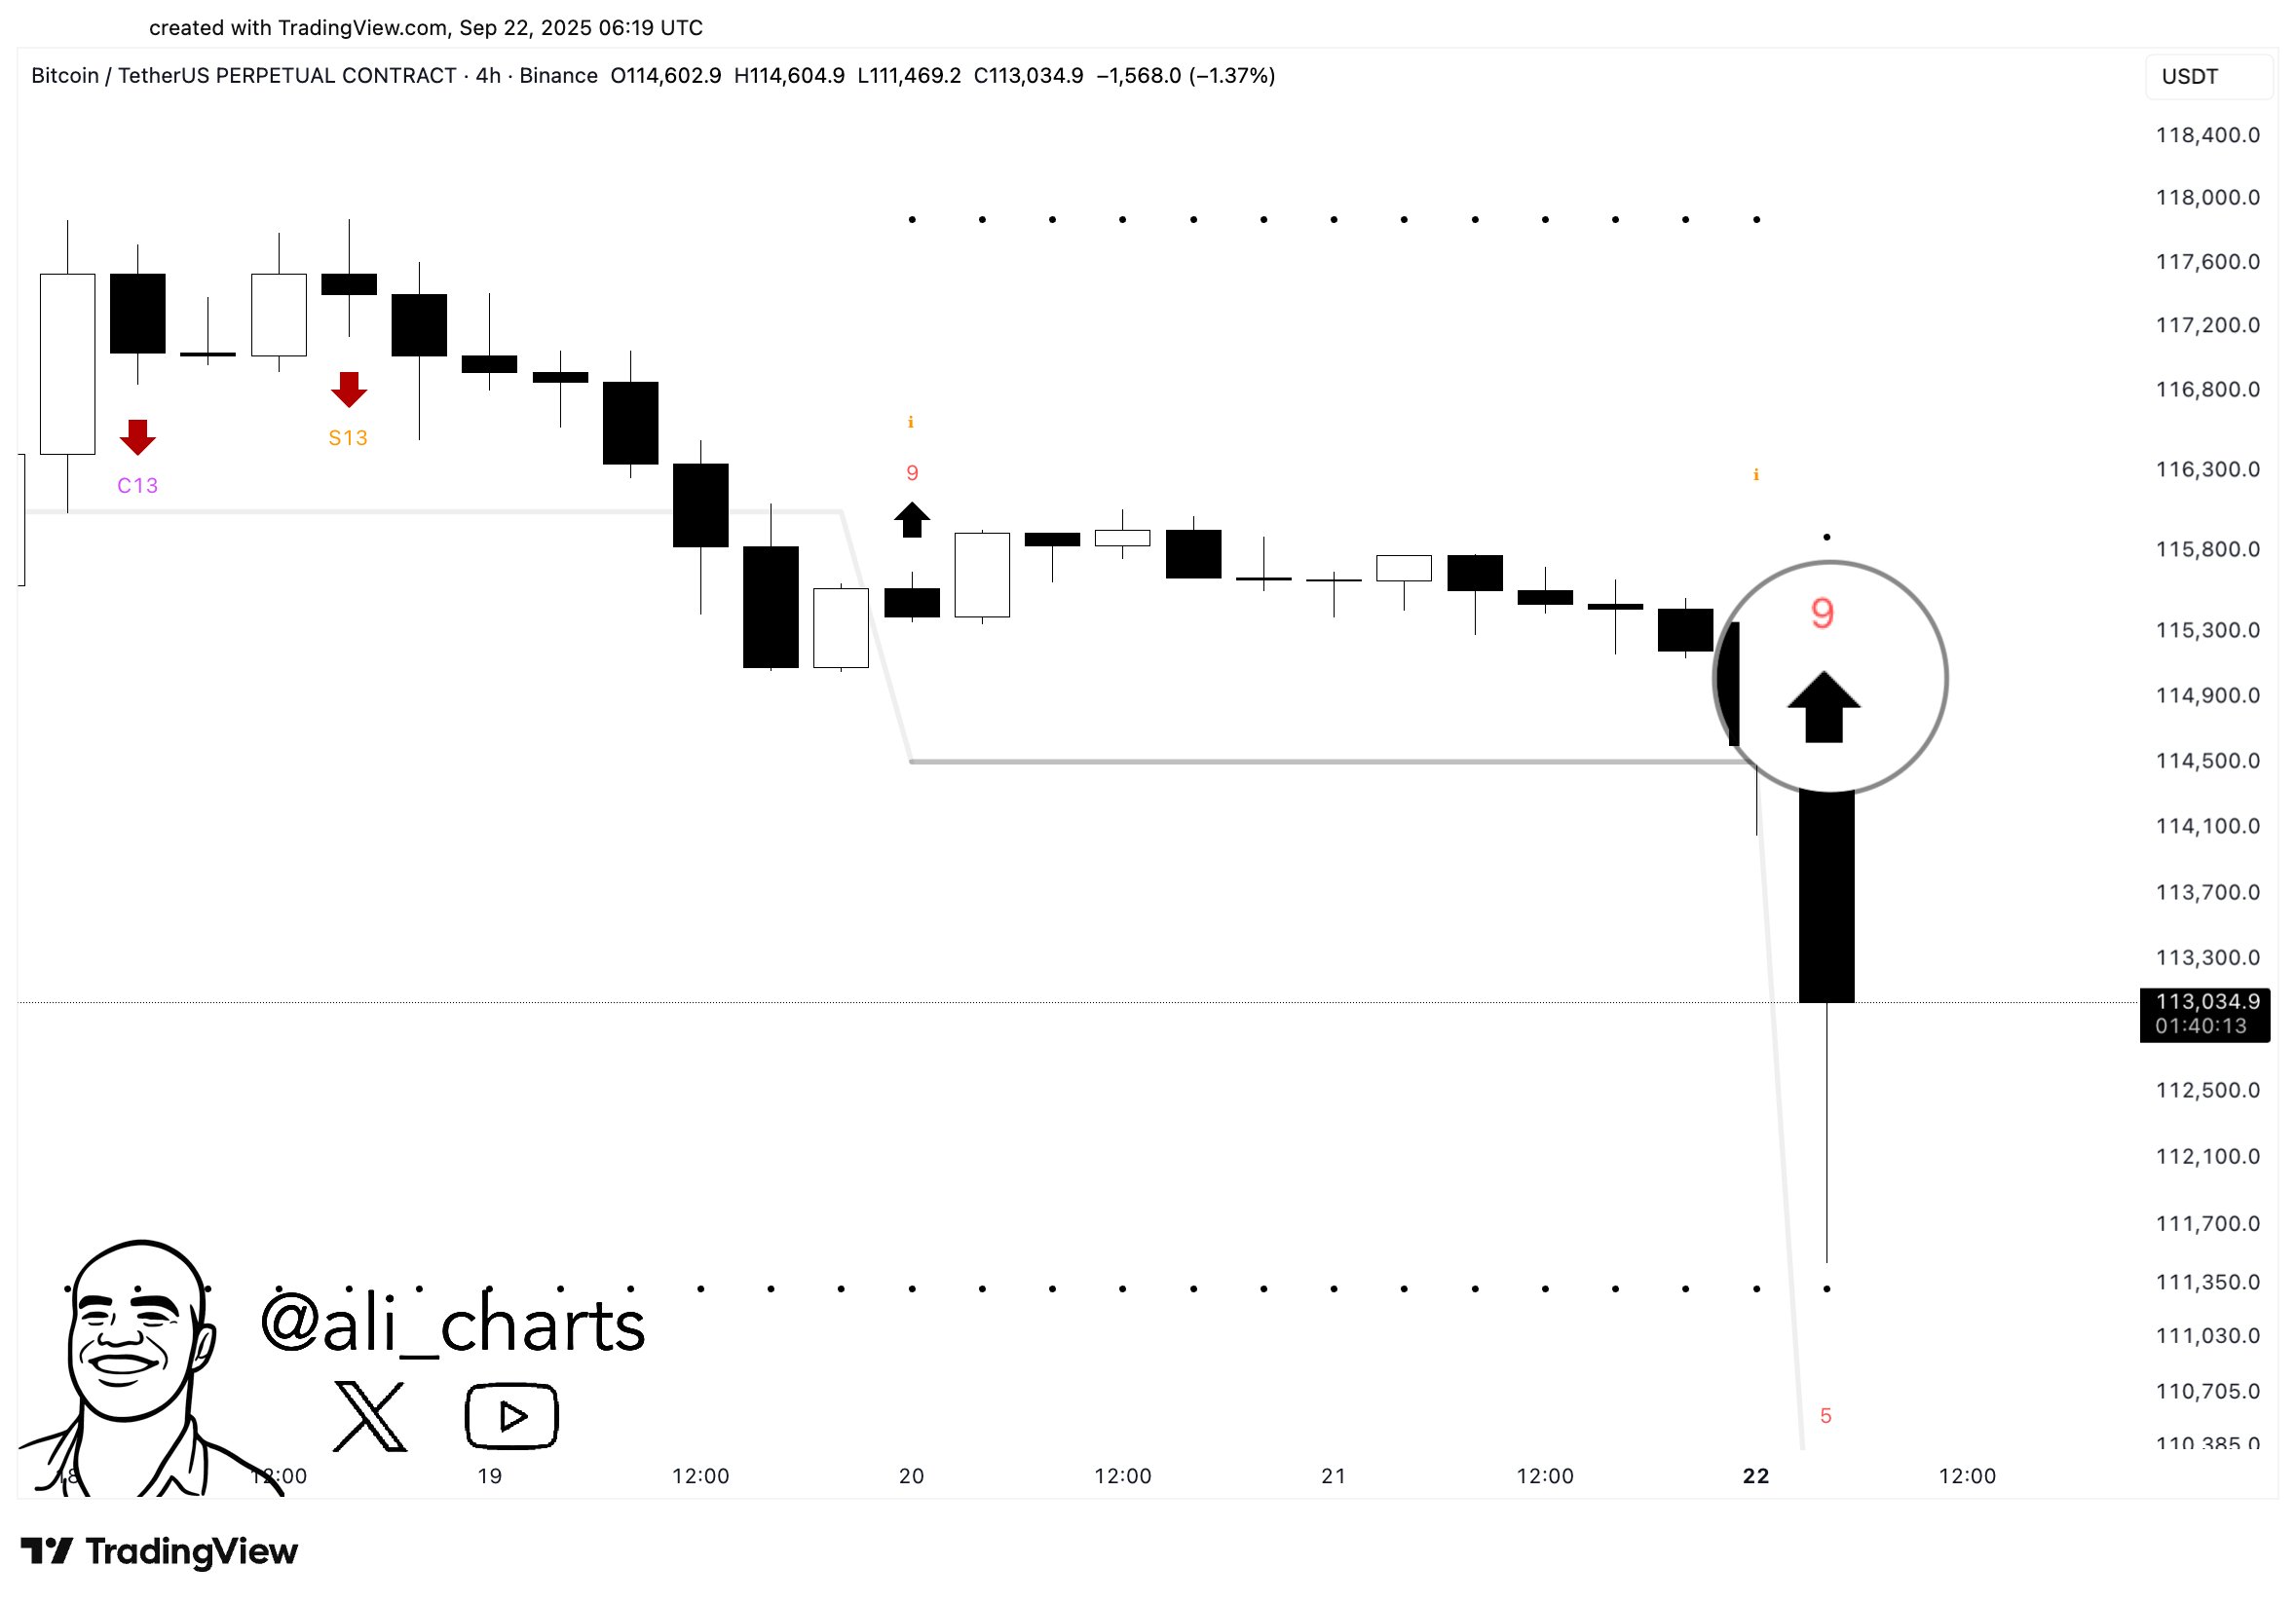
The current signal coincides with Bitcoin's recent price drop. The effectiveness of this buy setup remains to be seen.
Inverse Head-and-Shoulders Pattern
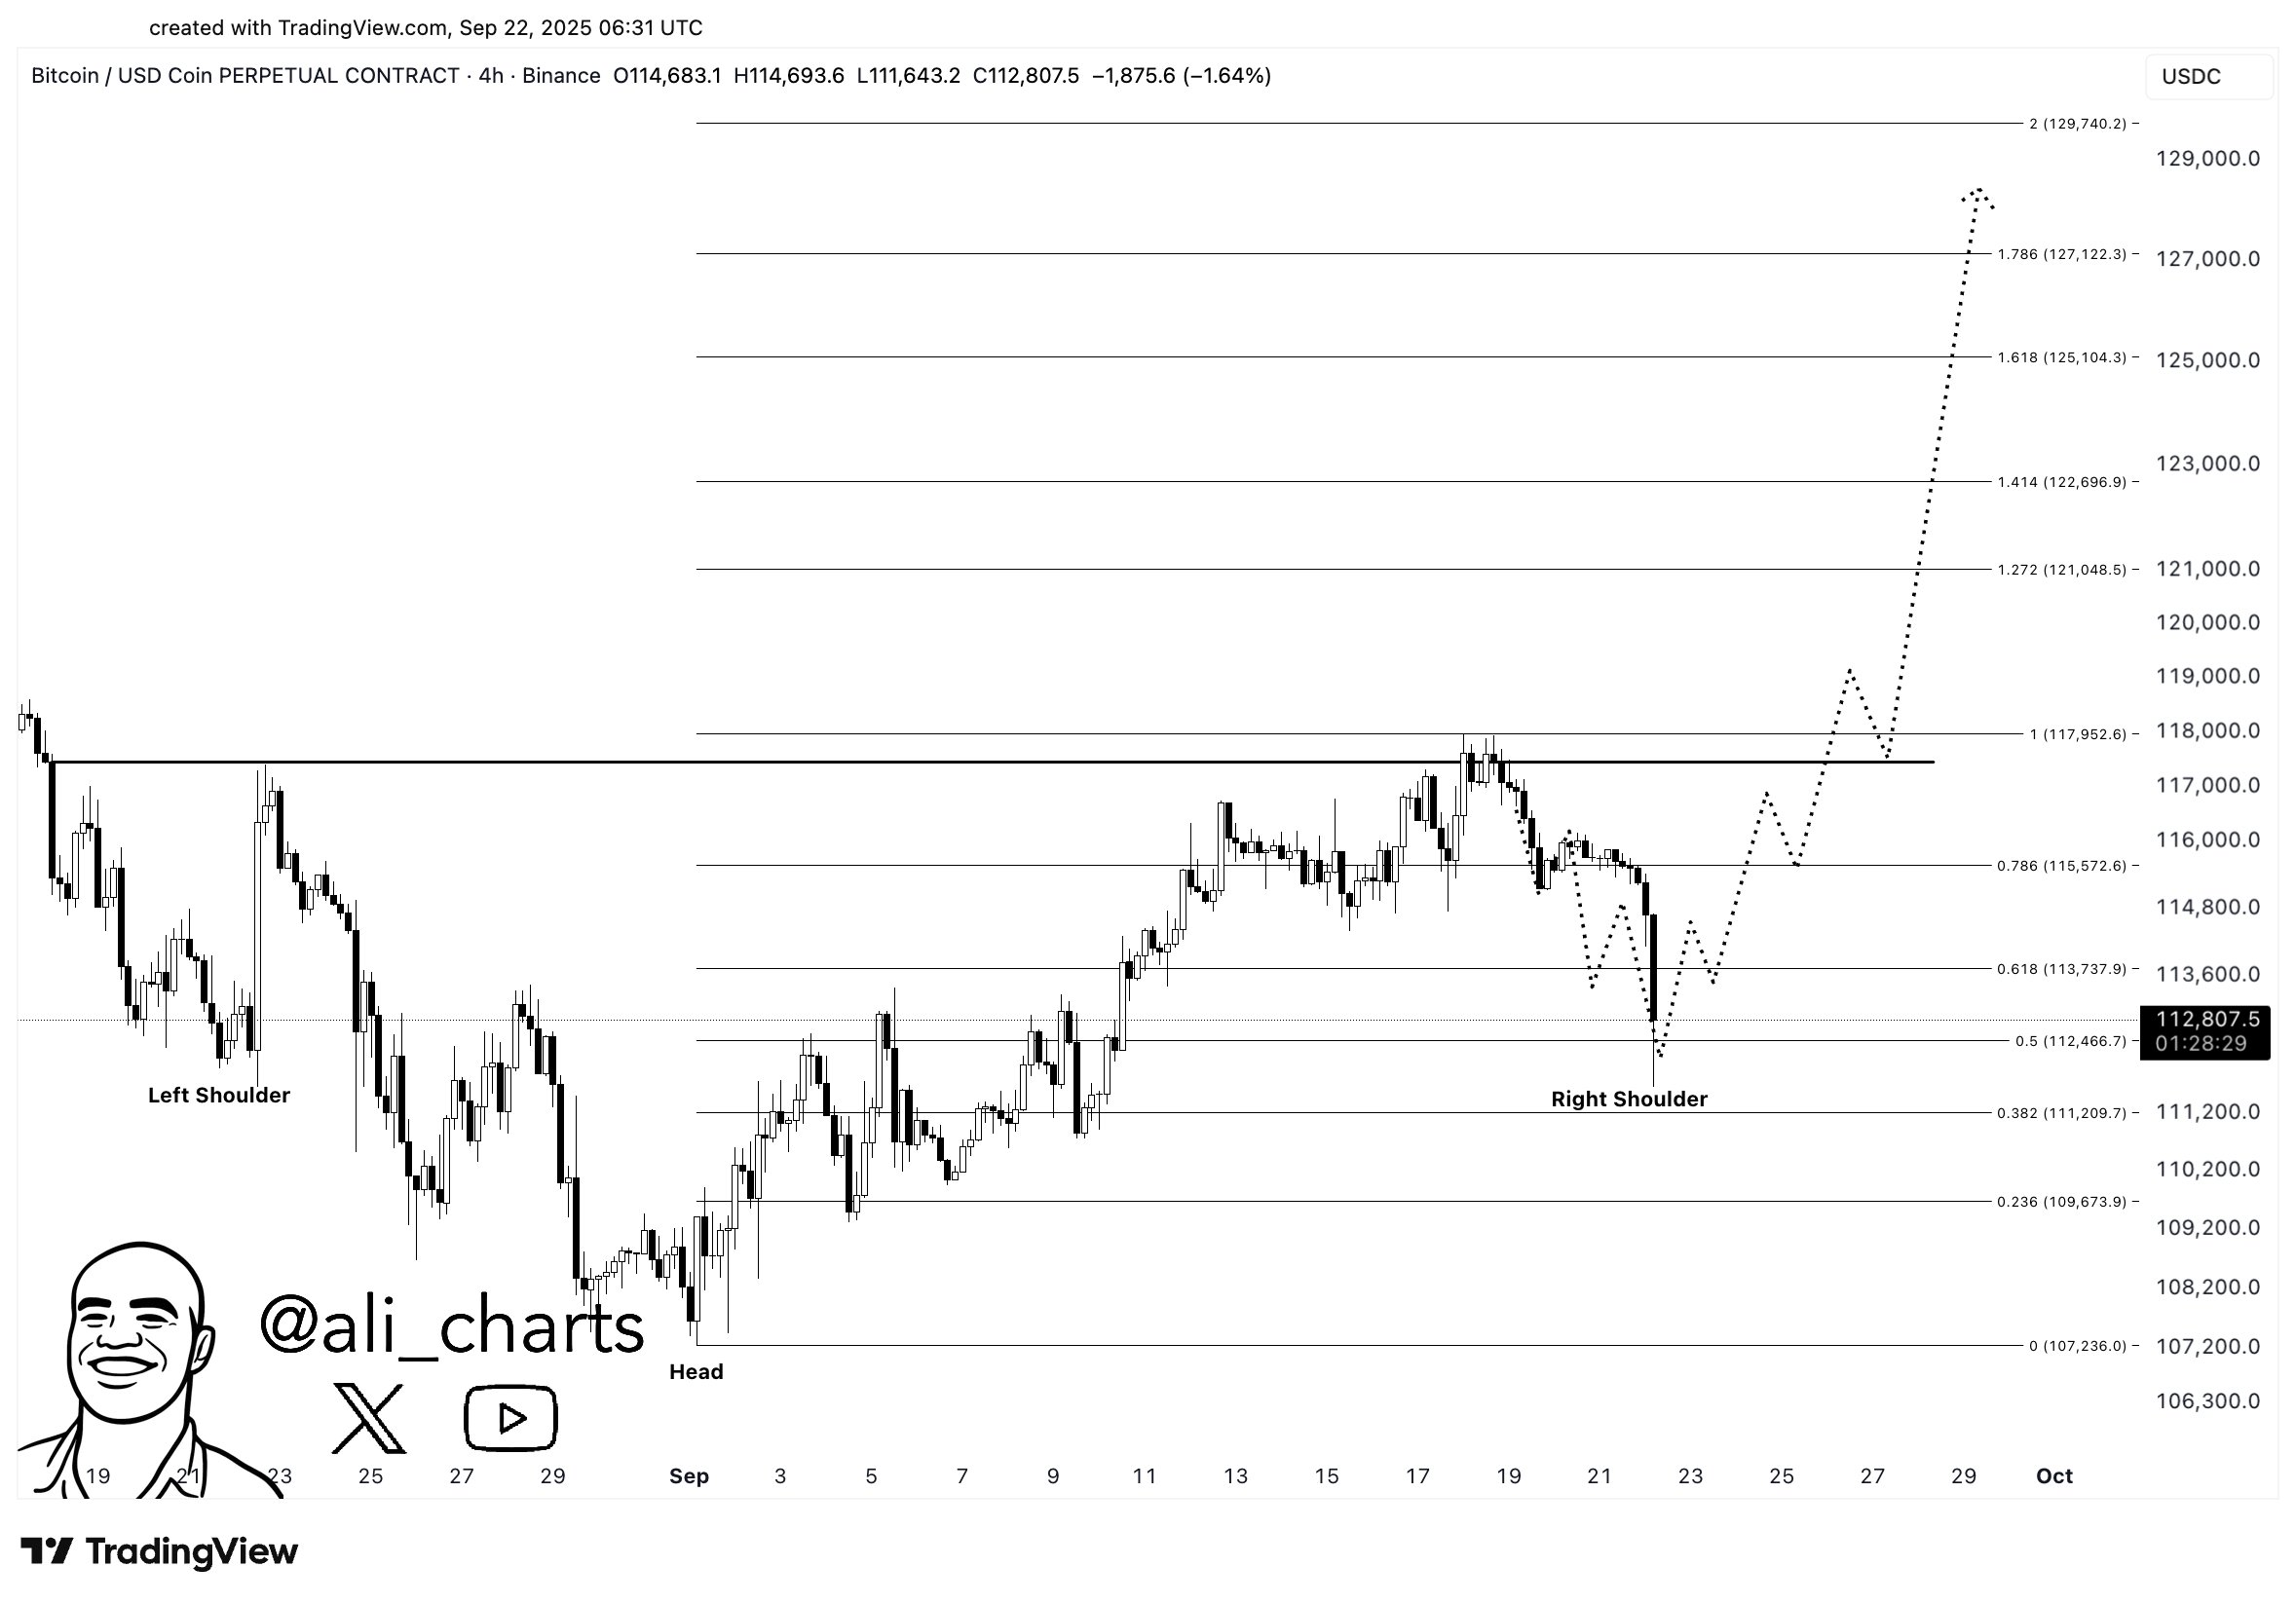
- A possible inverse head-and-shoulders pattern is forming on Bitcoin's 4-hour price chart.
- This pattern, characterized by a low between two higher lows, usually signals a bullish reversal.
- If the right shoulder forms, a bullish breakout may occur.
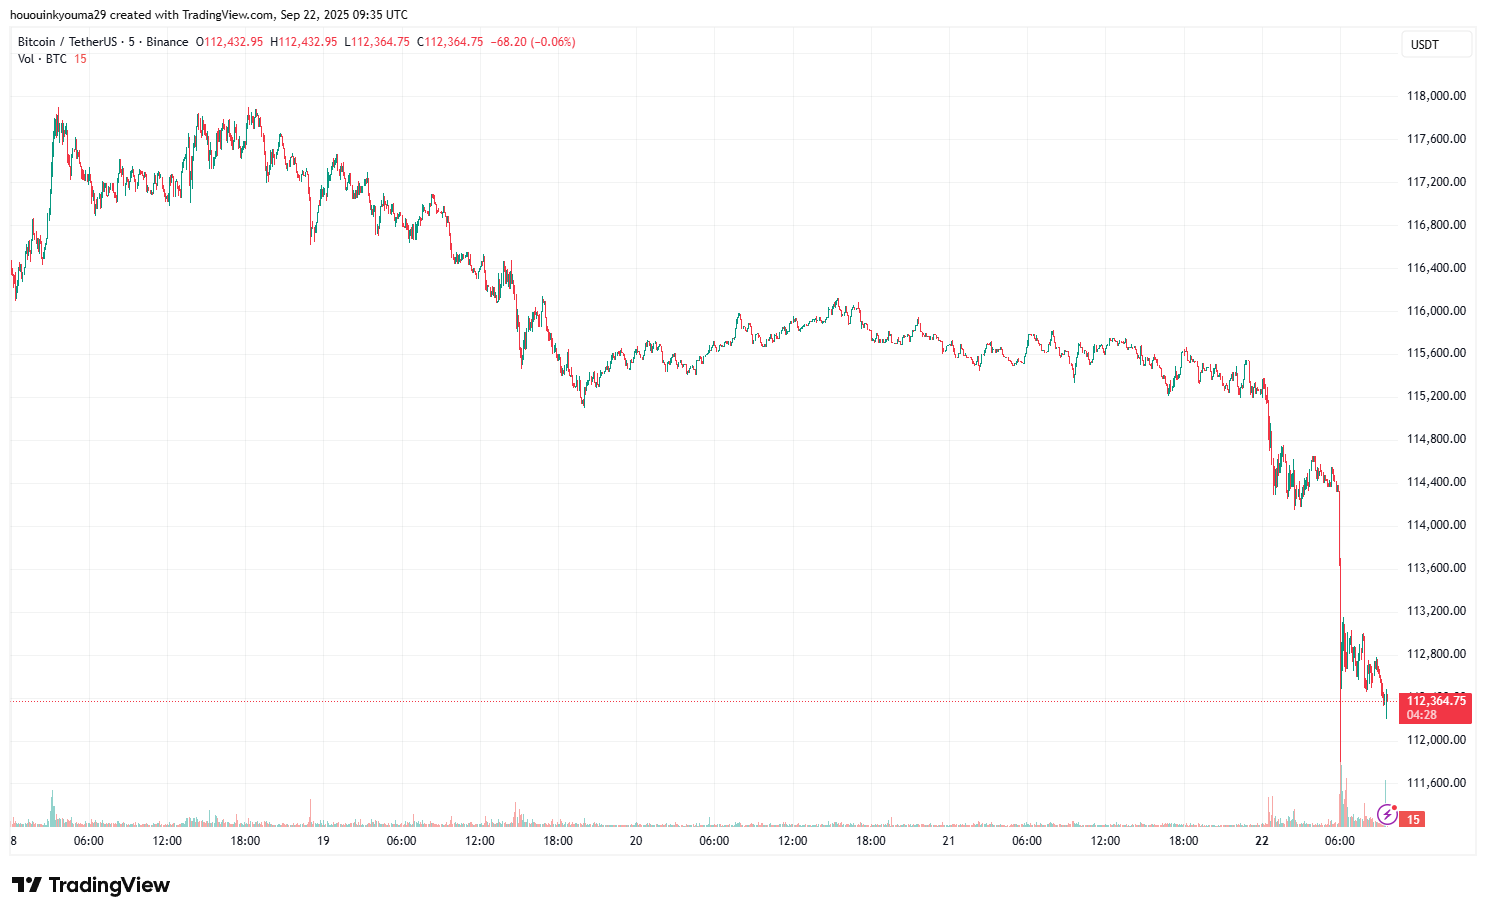
BTC Price
Bitcoin is currently trading around $112,300, experiencing a decline of over 2.5% in the last 24 hours.