Bitcoin Price Dips Below $98,000 Support Level
Bitcoin price declined below the $98,000 support level, dipping toward $95,000 before beginning a corrective recovery.
- Bitcoin fell below the $98,000 support zone.
- The price trades below $98,000 and the 100 hourly Simple Moving Average.
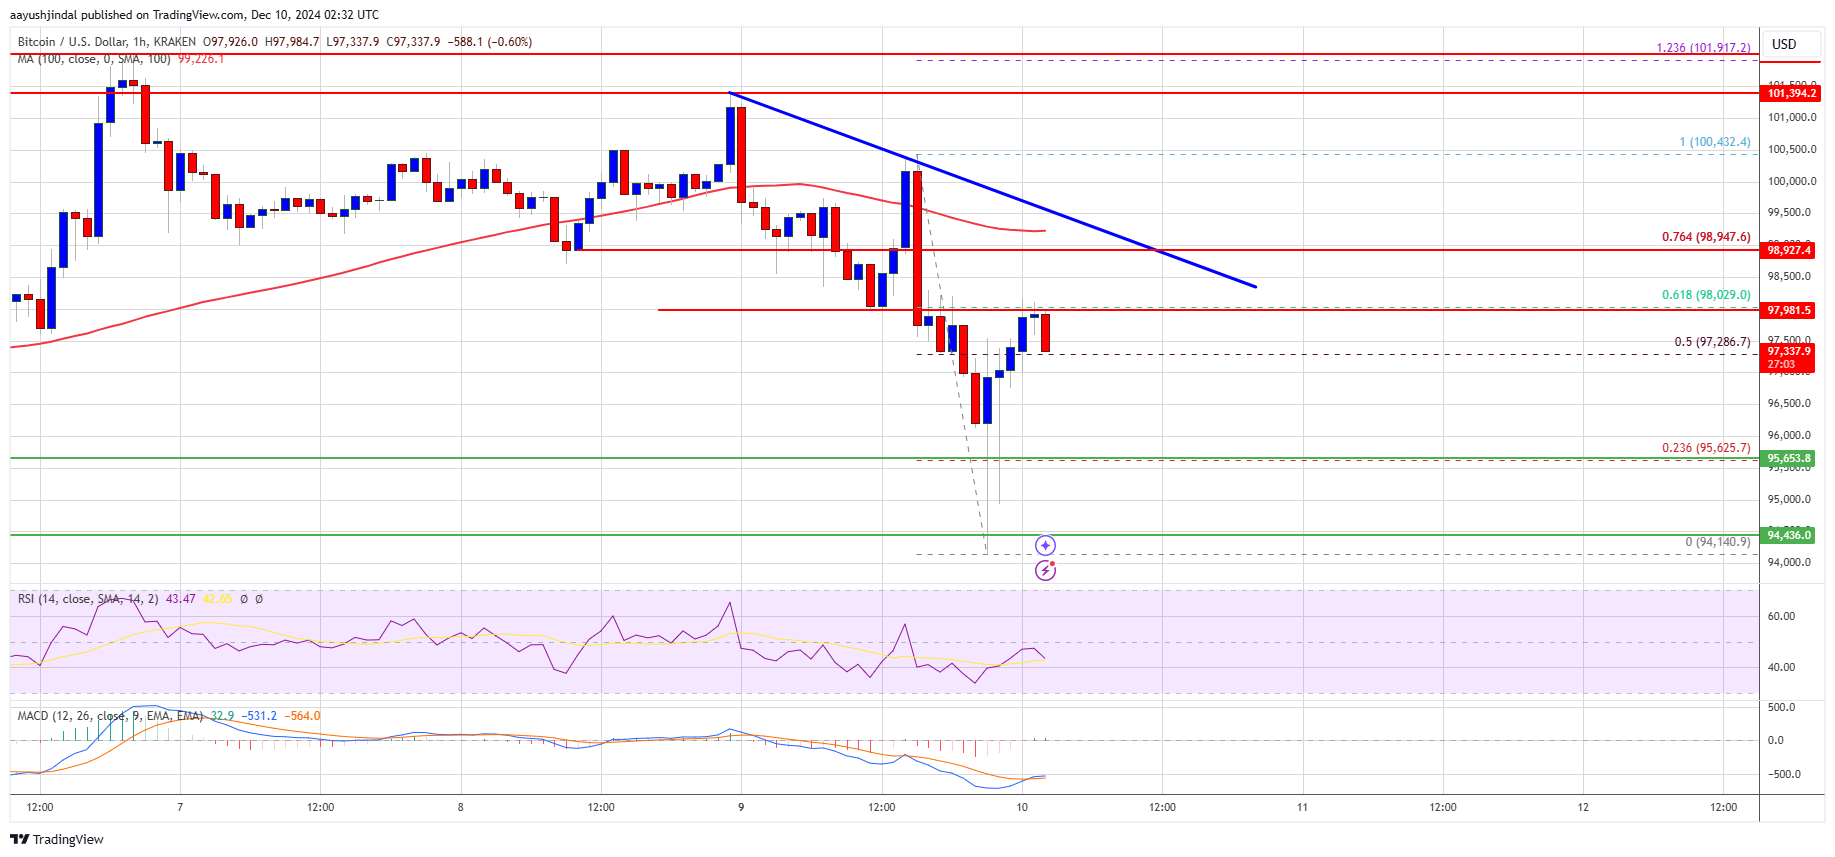
- A bearish trend line forms with resistance at $98,800 on the BTC/USD hourly chart (data from Kraken).
- A close above the $98,800 resistance may allow for momentum recovery.
Bitcoin Price Movement
Bitcoin struggled to maintain levels above $100,000, initiating a decline that brought it below $98,000, with movement beneath the $96,500 support.
The price dipped as low as $94,140 but has since begun to recover, surpassing $96,500. It climbed above the 50% Fibonacci retracement of the downward move from the $100,432 high to the $94,140 low.
Currently, Bitcoin trades below $100,000 and the 100 hourly Simple Moving Average. Resistance is anticipated near the $98,000 level, close to the 61.8% Fibonacci retracement of the previous downward wave.
The primary resistance is positioned at $98,800, coinciding with the forming bearish trend line on the hourly BTC/USD chart.
A decisive move above $98,800 could lead to further increases, potentially testing the next key resistance at $100,000. A close above $100,000 might propel the price toward $104,200, with additional gains possibly reaching $108,000.
Potential for Further Decline
If Bitcoin does not surpass the $98,800 resistance, another decline may occur. Immediate support is around $96,500.
Major support levels are identified at $95,500 and $94,200. Additional losses could drive the price down to the $92,000 support in the near term.
Technical indicators:
Hourly MACD – The MACD is decreasing in the bearish zone.
Hourly RSI (Relative Strength Index) – The RSI for BTC/USD is below the 50 level.
Major Support Levels – $96,500 and $95,500.
Major Resistance Levels – $98,000 and $98,800.
