Updated 21 December
Bitcoin Price Retraces 11.5% from All-Time High Amid Market Speculation
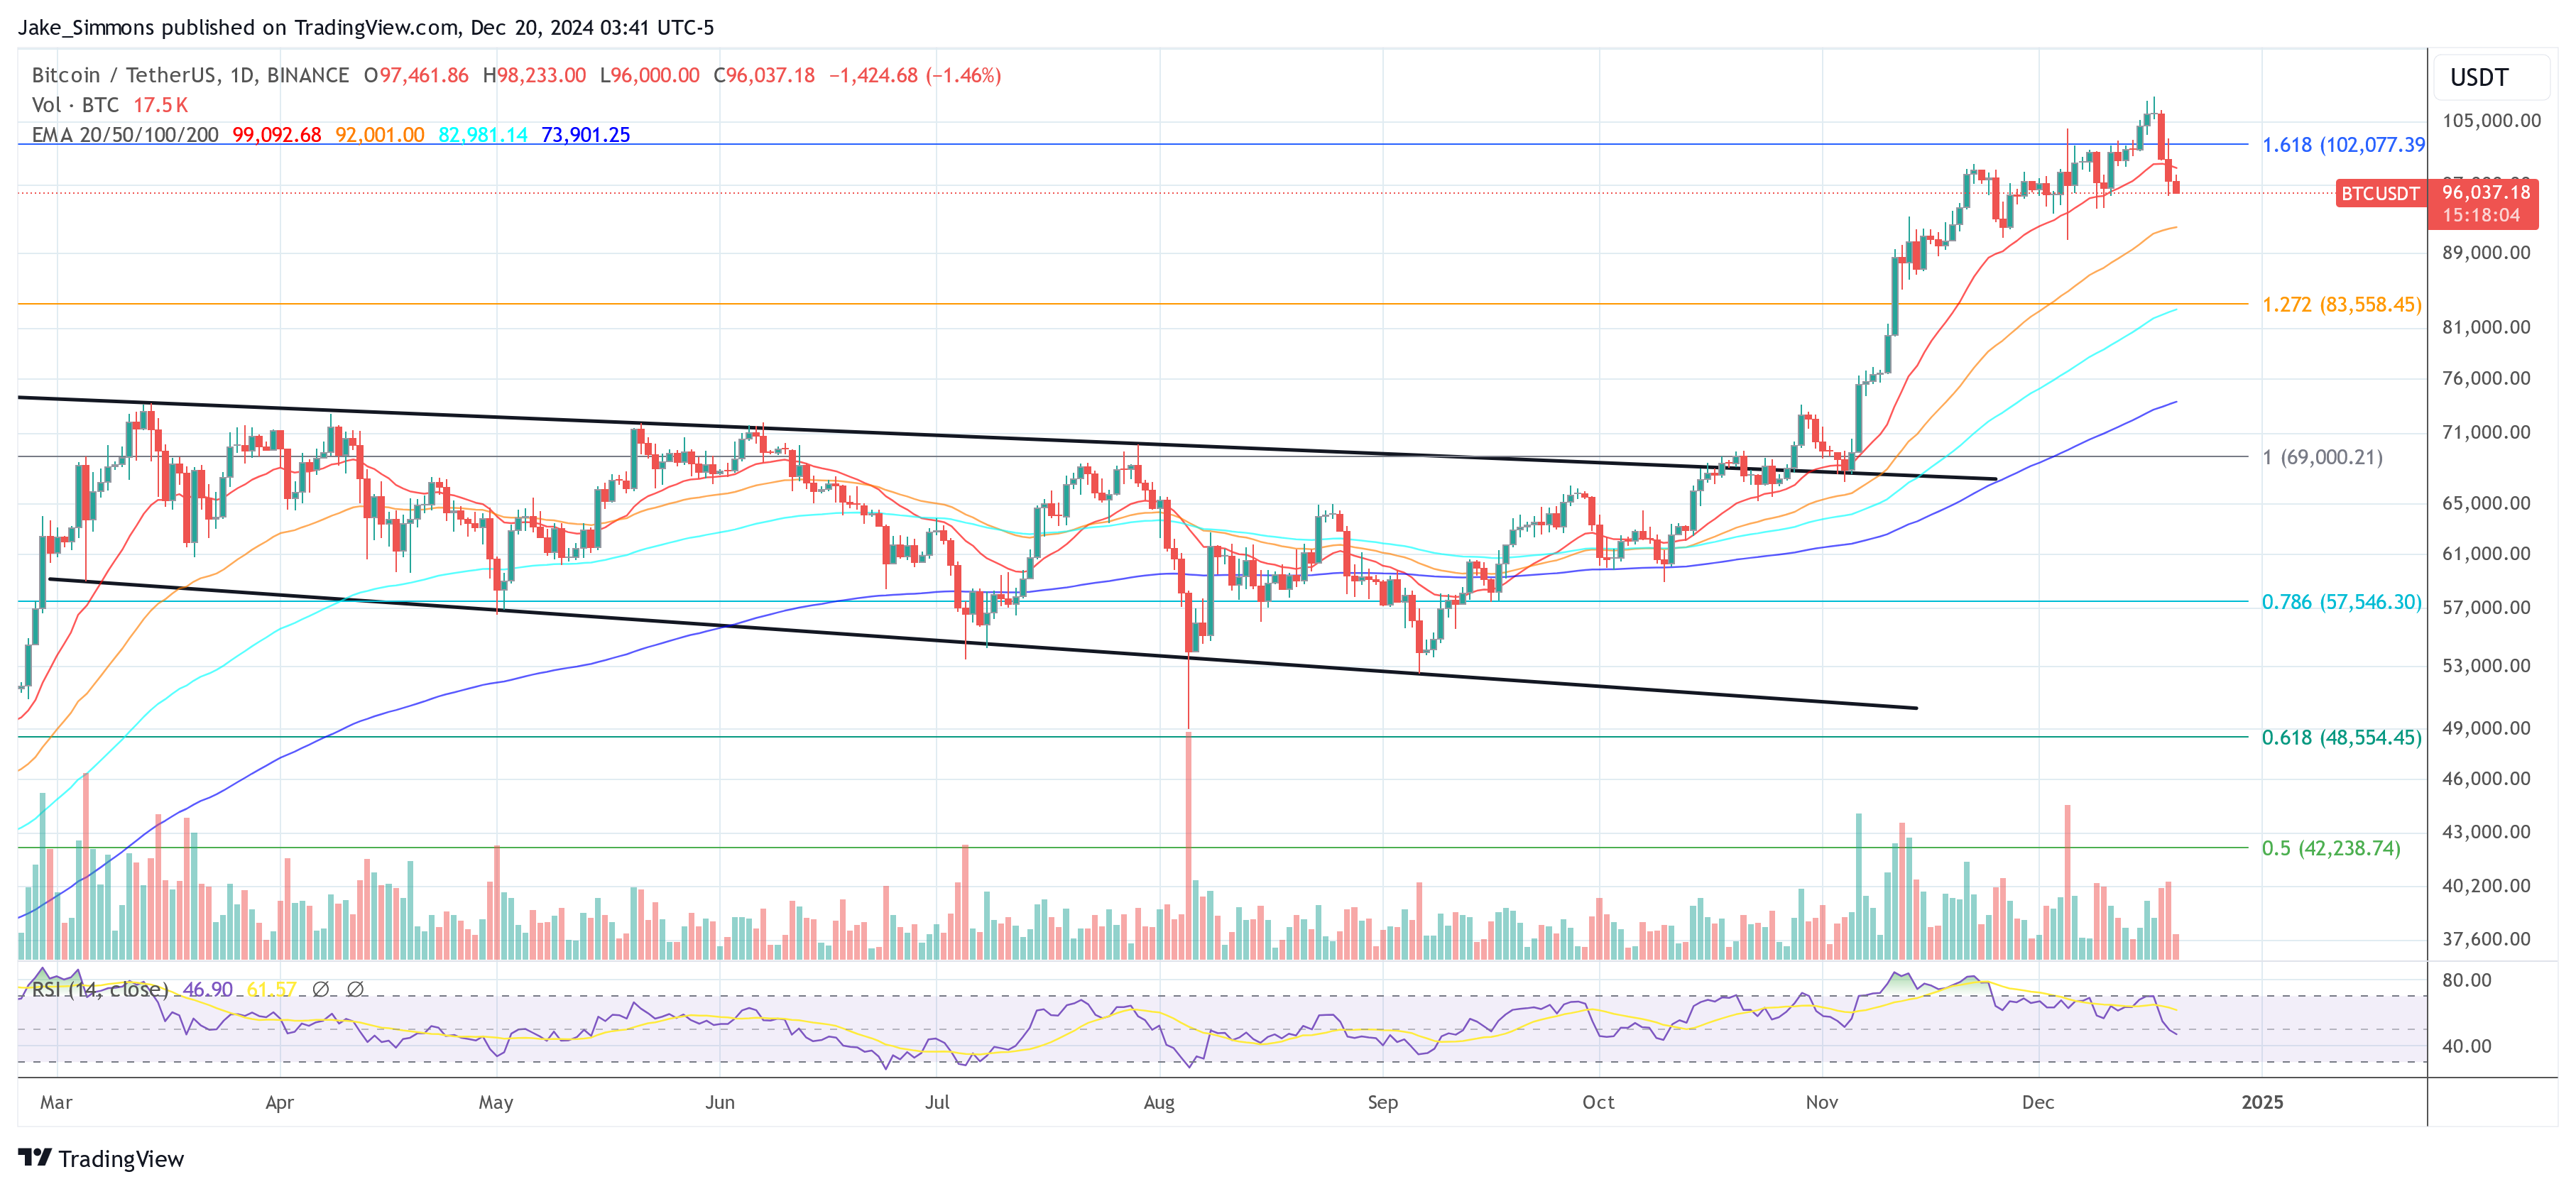
Bitcoin's price retraced from a new all-time high of $108,353 to approximately $96,000, marking an -11.5% pullback. This decline has sparked speculation regarding the potential peak of the current bull cycle. Rafael Schultze-Kraft, co-founder of Glassnode, released a thread analyzing 18 on-chain metrics to evaluate if Bitcoin has reached its cycle top.
Has Bitcoin Reached Its Cycle Top?
1/ MVRV Ratio: The MVRV ratio compares market value to realized value. Historically, readings above 7 indicated overheated conditions. Currently at around 3, there is potential for growth, suggesting the market has not yet reached previous macro tops.
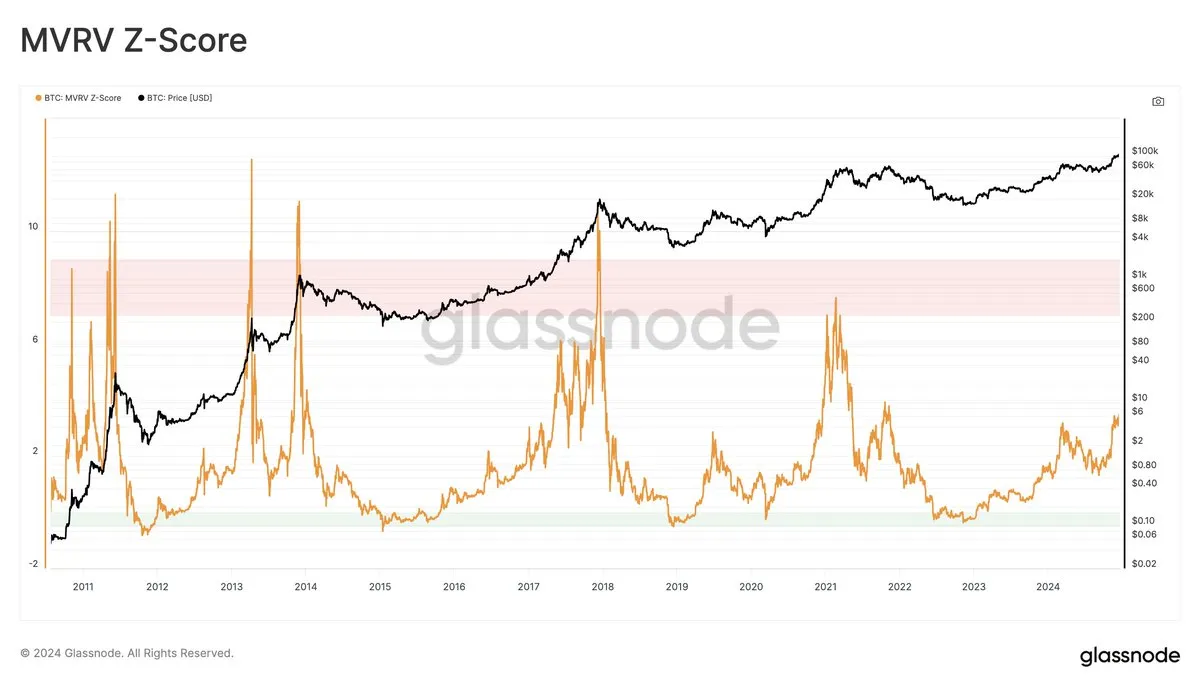
2/ MVRV Pricing Bands: The top band, historically exceeded in only about 6% of trading days, is currently aligned with a price of $127,000. With Bitcoin around $98,000, the market has not yet entered the zone associated with previous peaks.
3/ Long-Term Holder Profitability (Relative Unrealized Profit & LTH-NUPL): The LTH-NUPL metric is at 0.75, entering the “euphoria zone.” Historical tops often saw LTH-NUPL readings above 0.9, indicating that while elevated, current levels have not reached cycle extremes.
4/ Yearly Realized Profit/Loss Ratio: This ratio measures total realized profits relative to losses over the past year. Currently at around 580%, it suggests room for growth before reaching historically significant levels.
5/ Market Cap To Thermocap Ratio: This early metric compares Bitcoin’s market capitalization to cumulative mining costs. Current levels are not close to previous extremes seen during market tops.
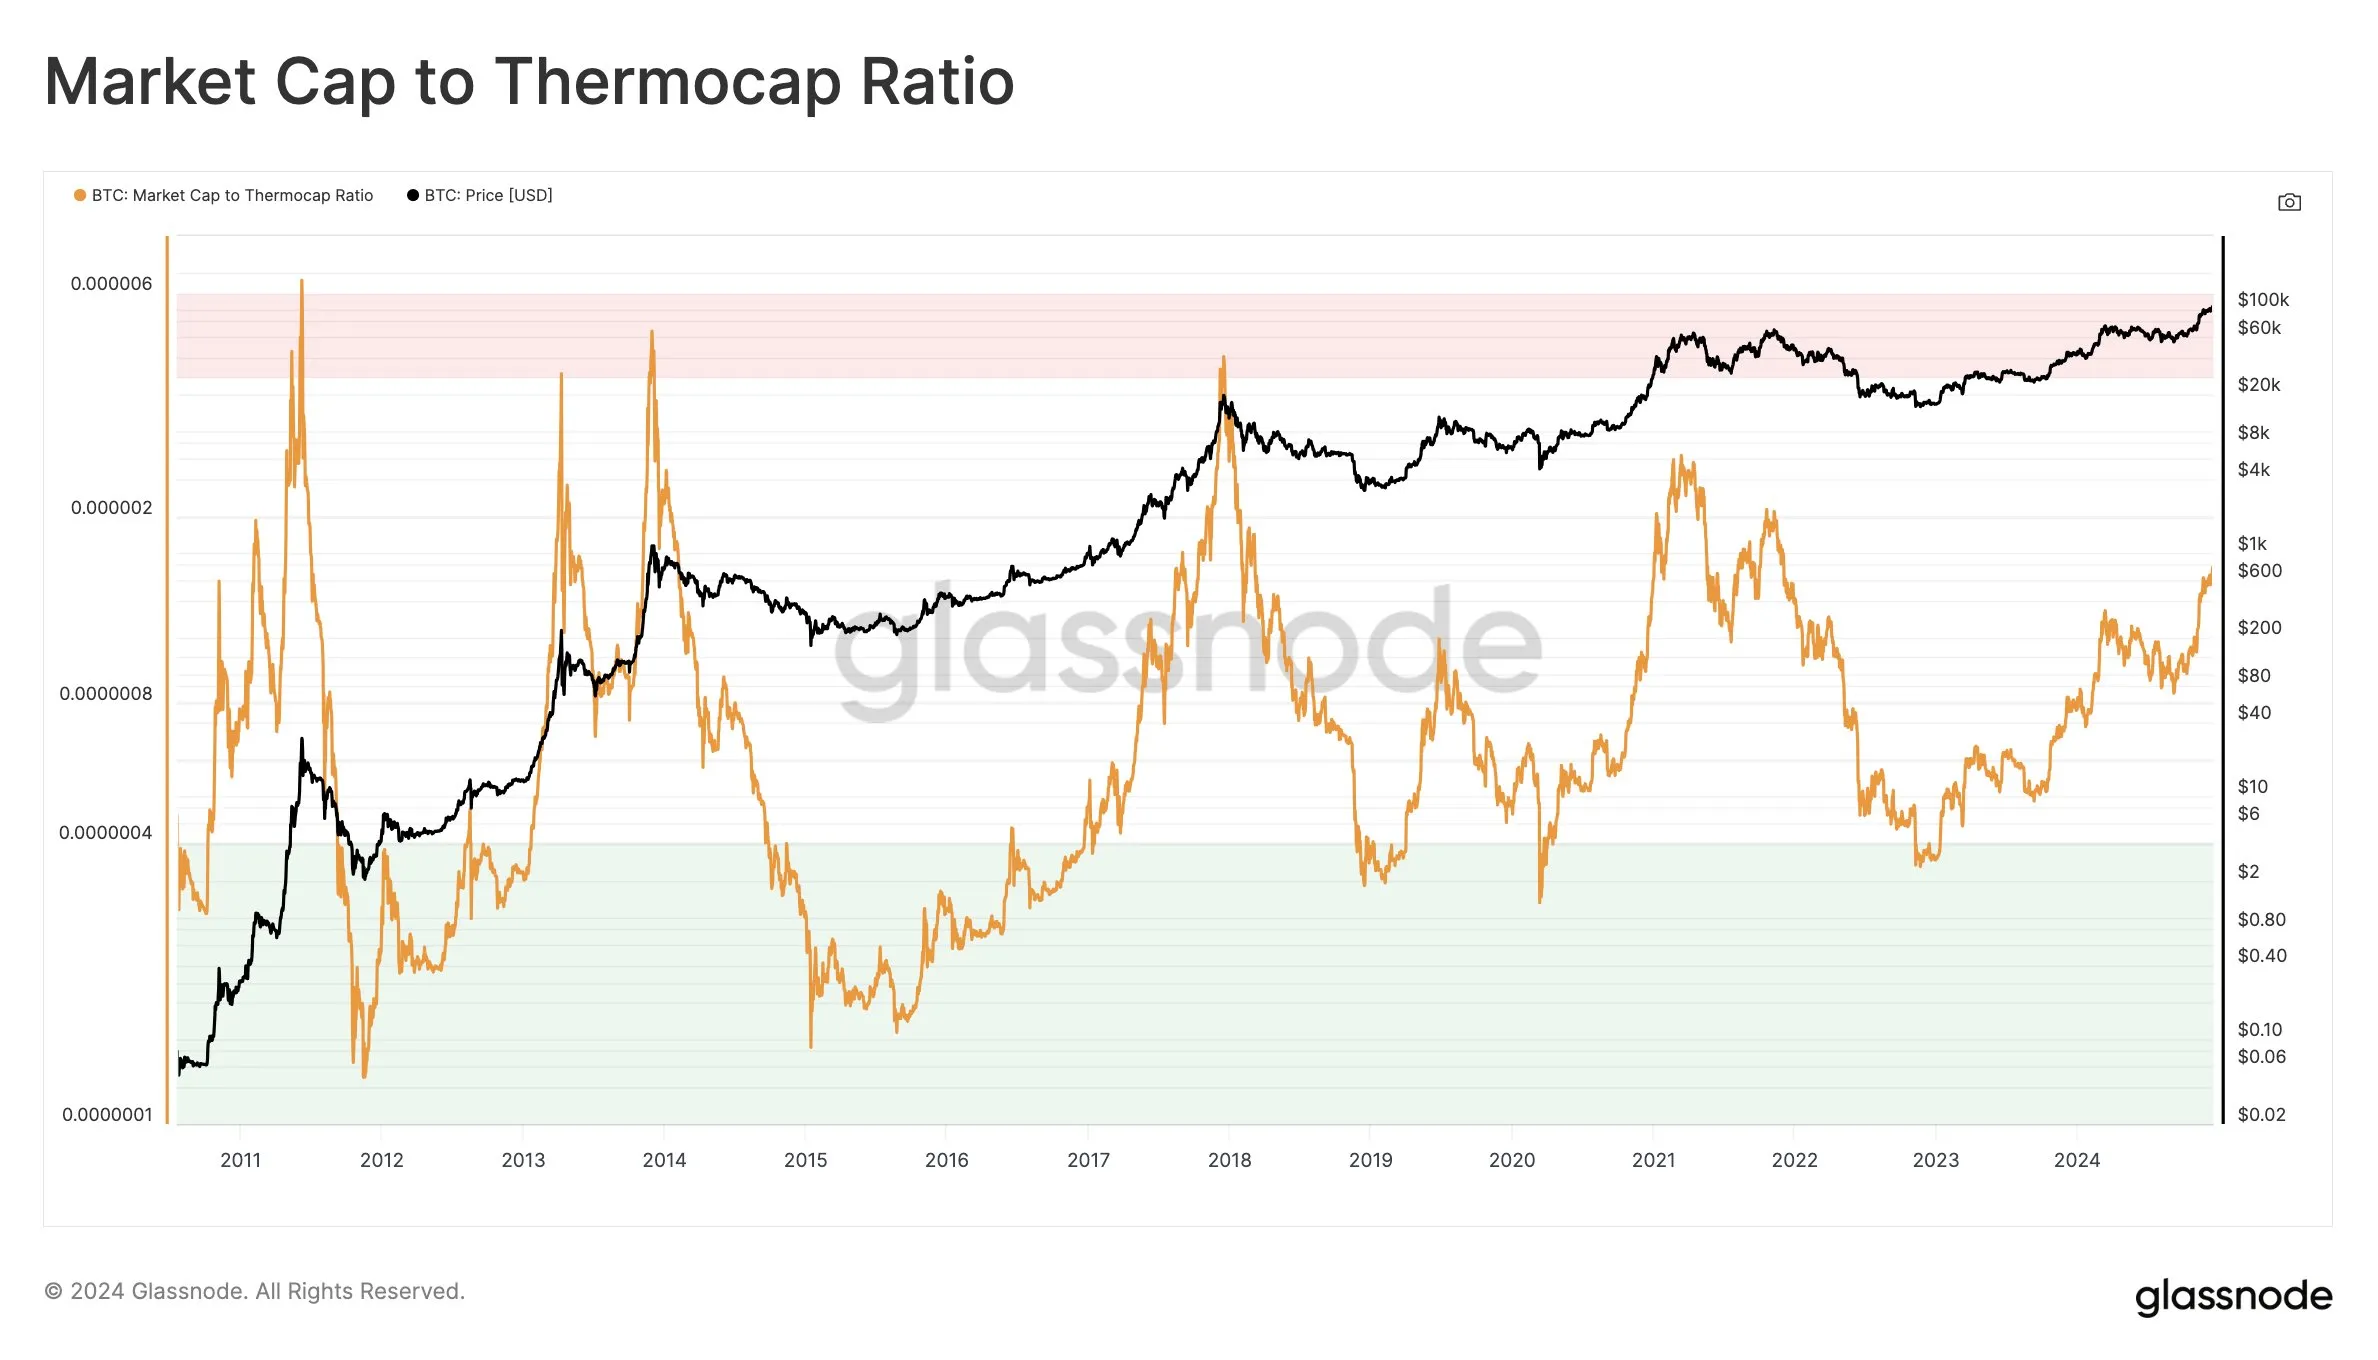
6/ Thermocap Multiples (32-64x): Bitcoin has previously topped at about 32-64 times the Thermocap. Current valuations suggest potential upside if historical patterns hold.
7/ The Investor Tool (2-Year SMA x5): This tool indicates potential top zones at $230,000, implying that the indicator has not yet signaled a definitive market top.
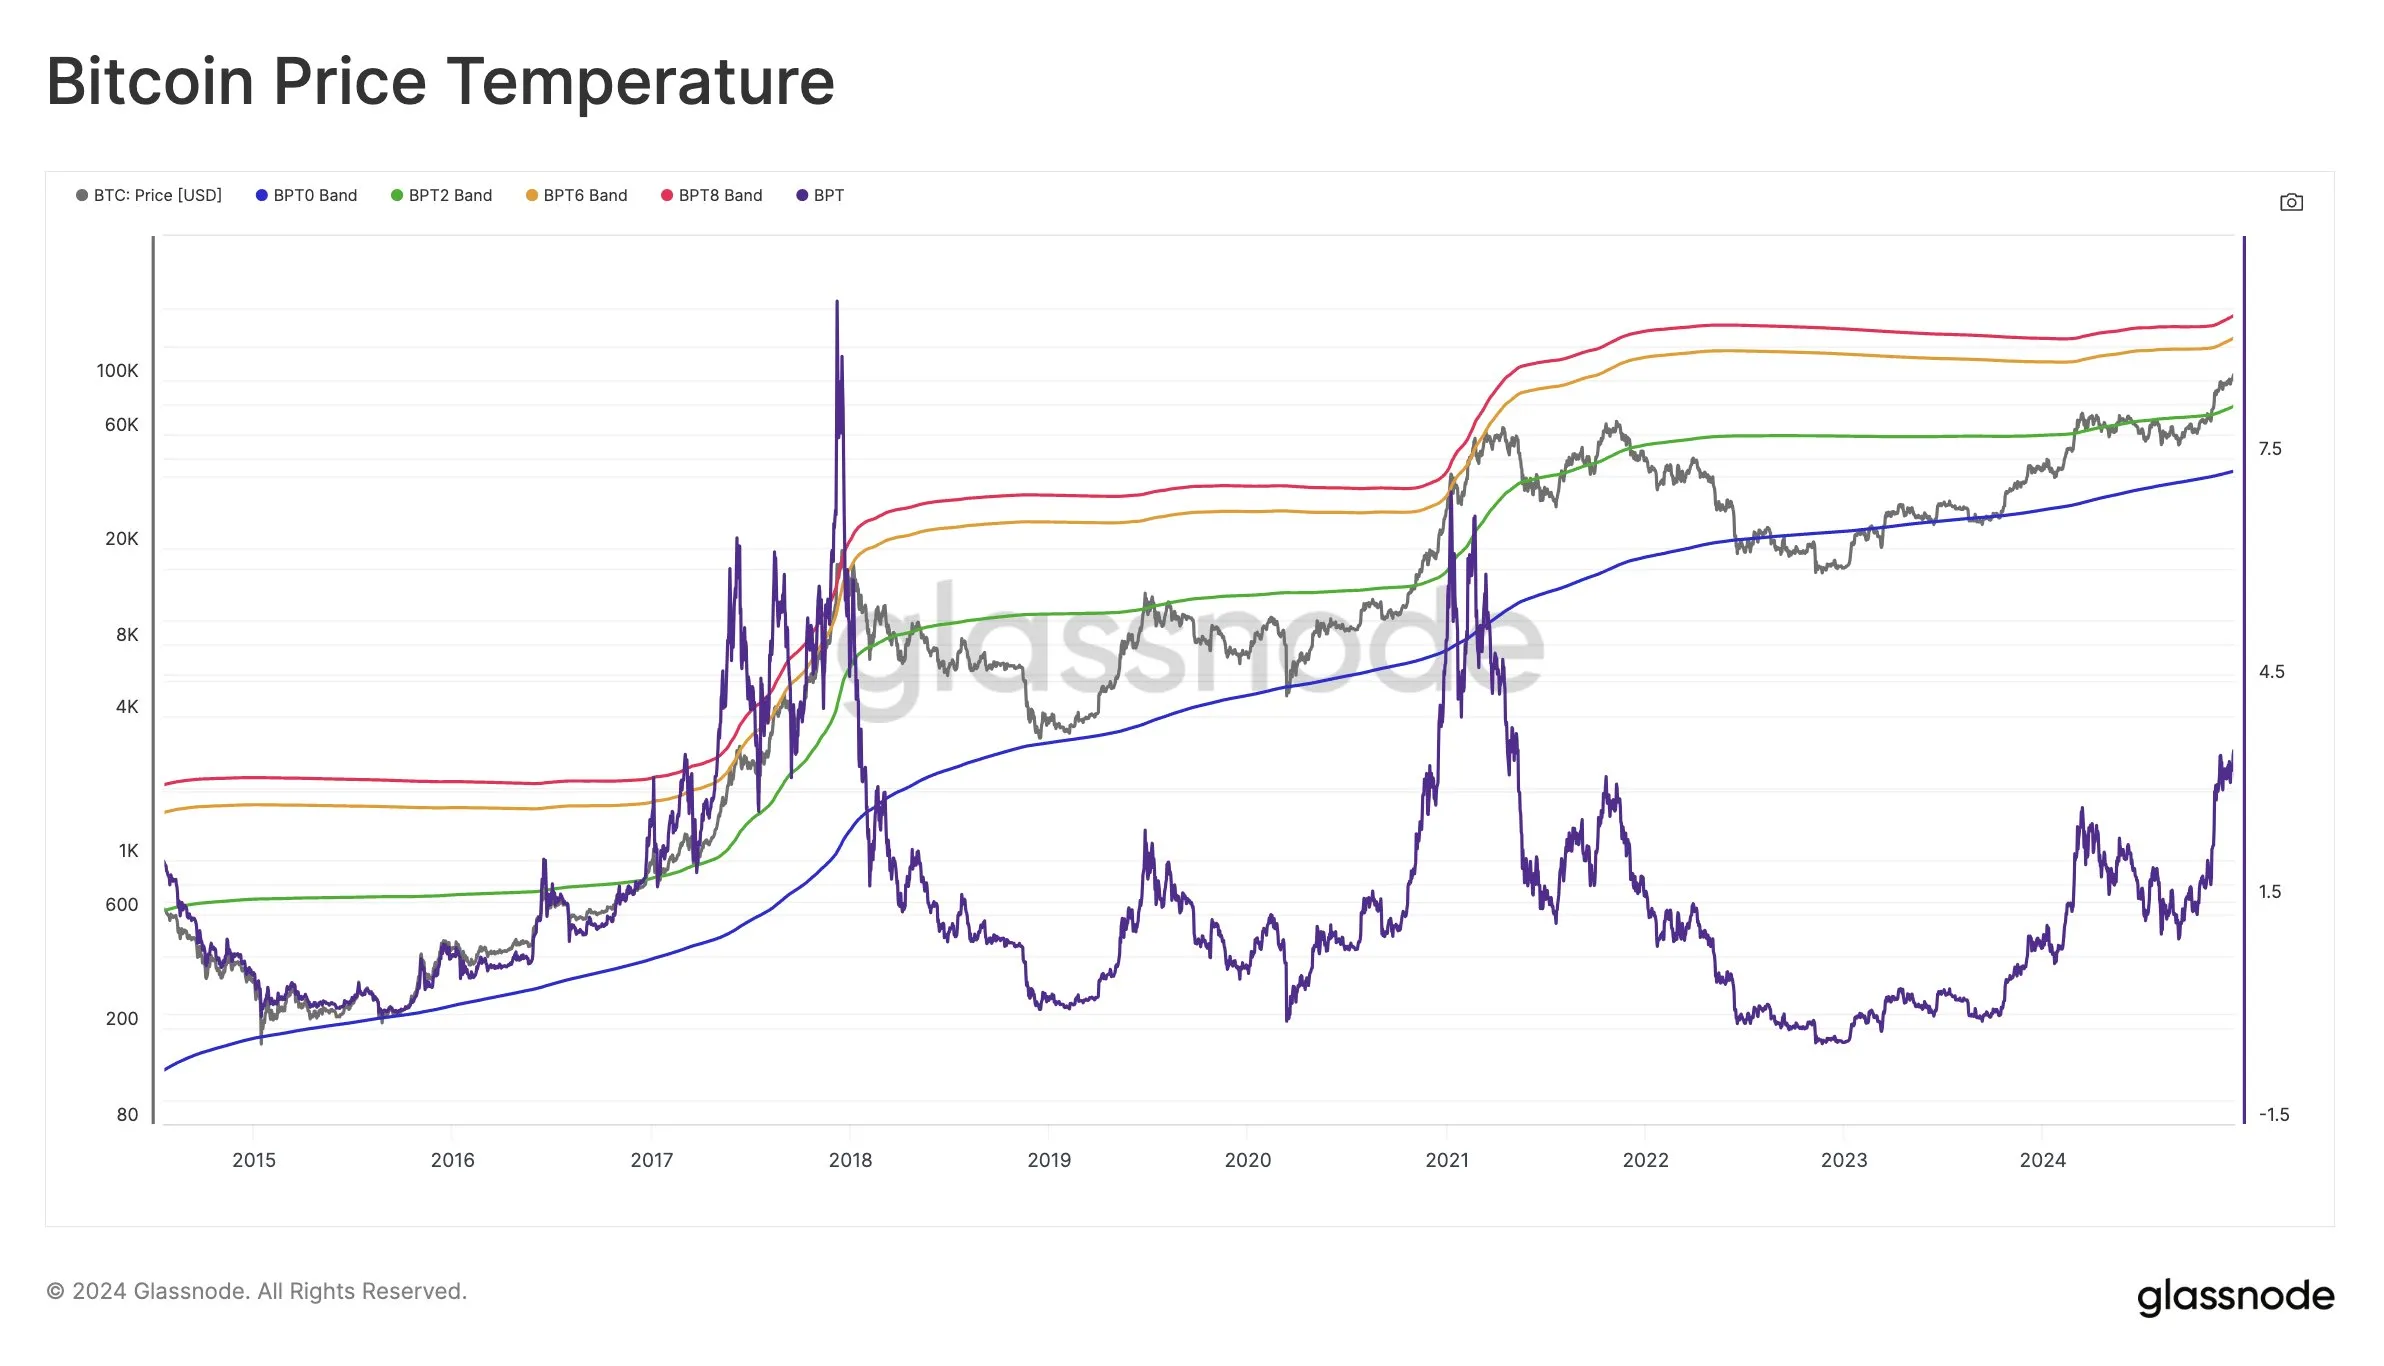
8/ Bitcoin Price Temperature (BPT6): This model captures cyclical price extremes, currently set at $151,000, indicating that the market has not reached peak overheating levels.
9/ The True Market Mean & AVIV: The True Market Mean sees current values at 1.7, suggesting that the market is not yet stretched to historical extremes.
10/ Low/Mid/Top Cap Models (Delta Cap Derivatives): The mid cap level sits at about $4 trillion, indicating significant growth potential before hitting levels typical of earlier tops.
11/ Value Days Destroyed Multiple (VDDM): Currently at 2.2, this metric shows that long-term holders have not yet fully capitulated to profit-taking.
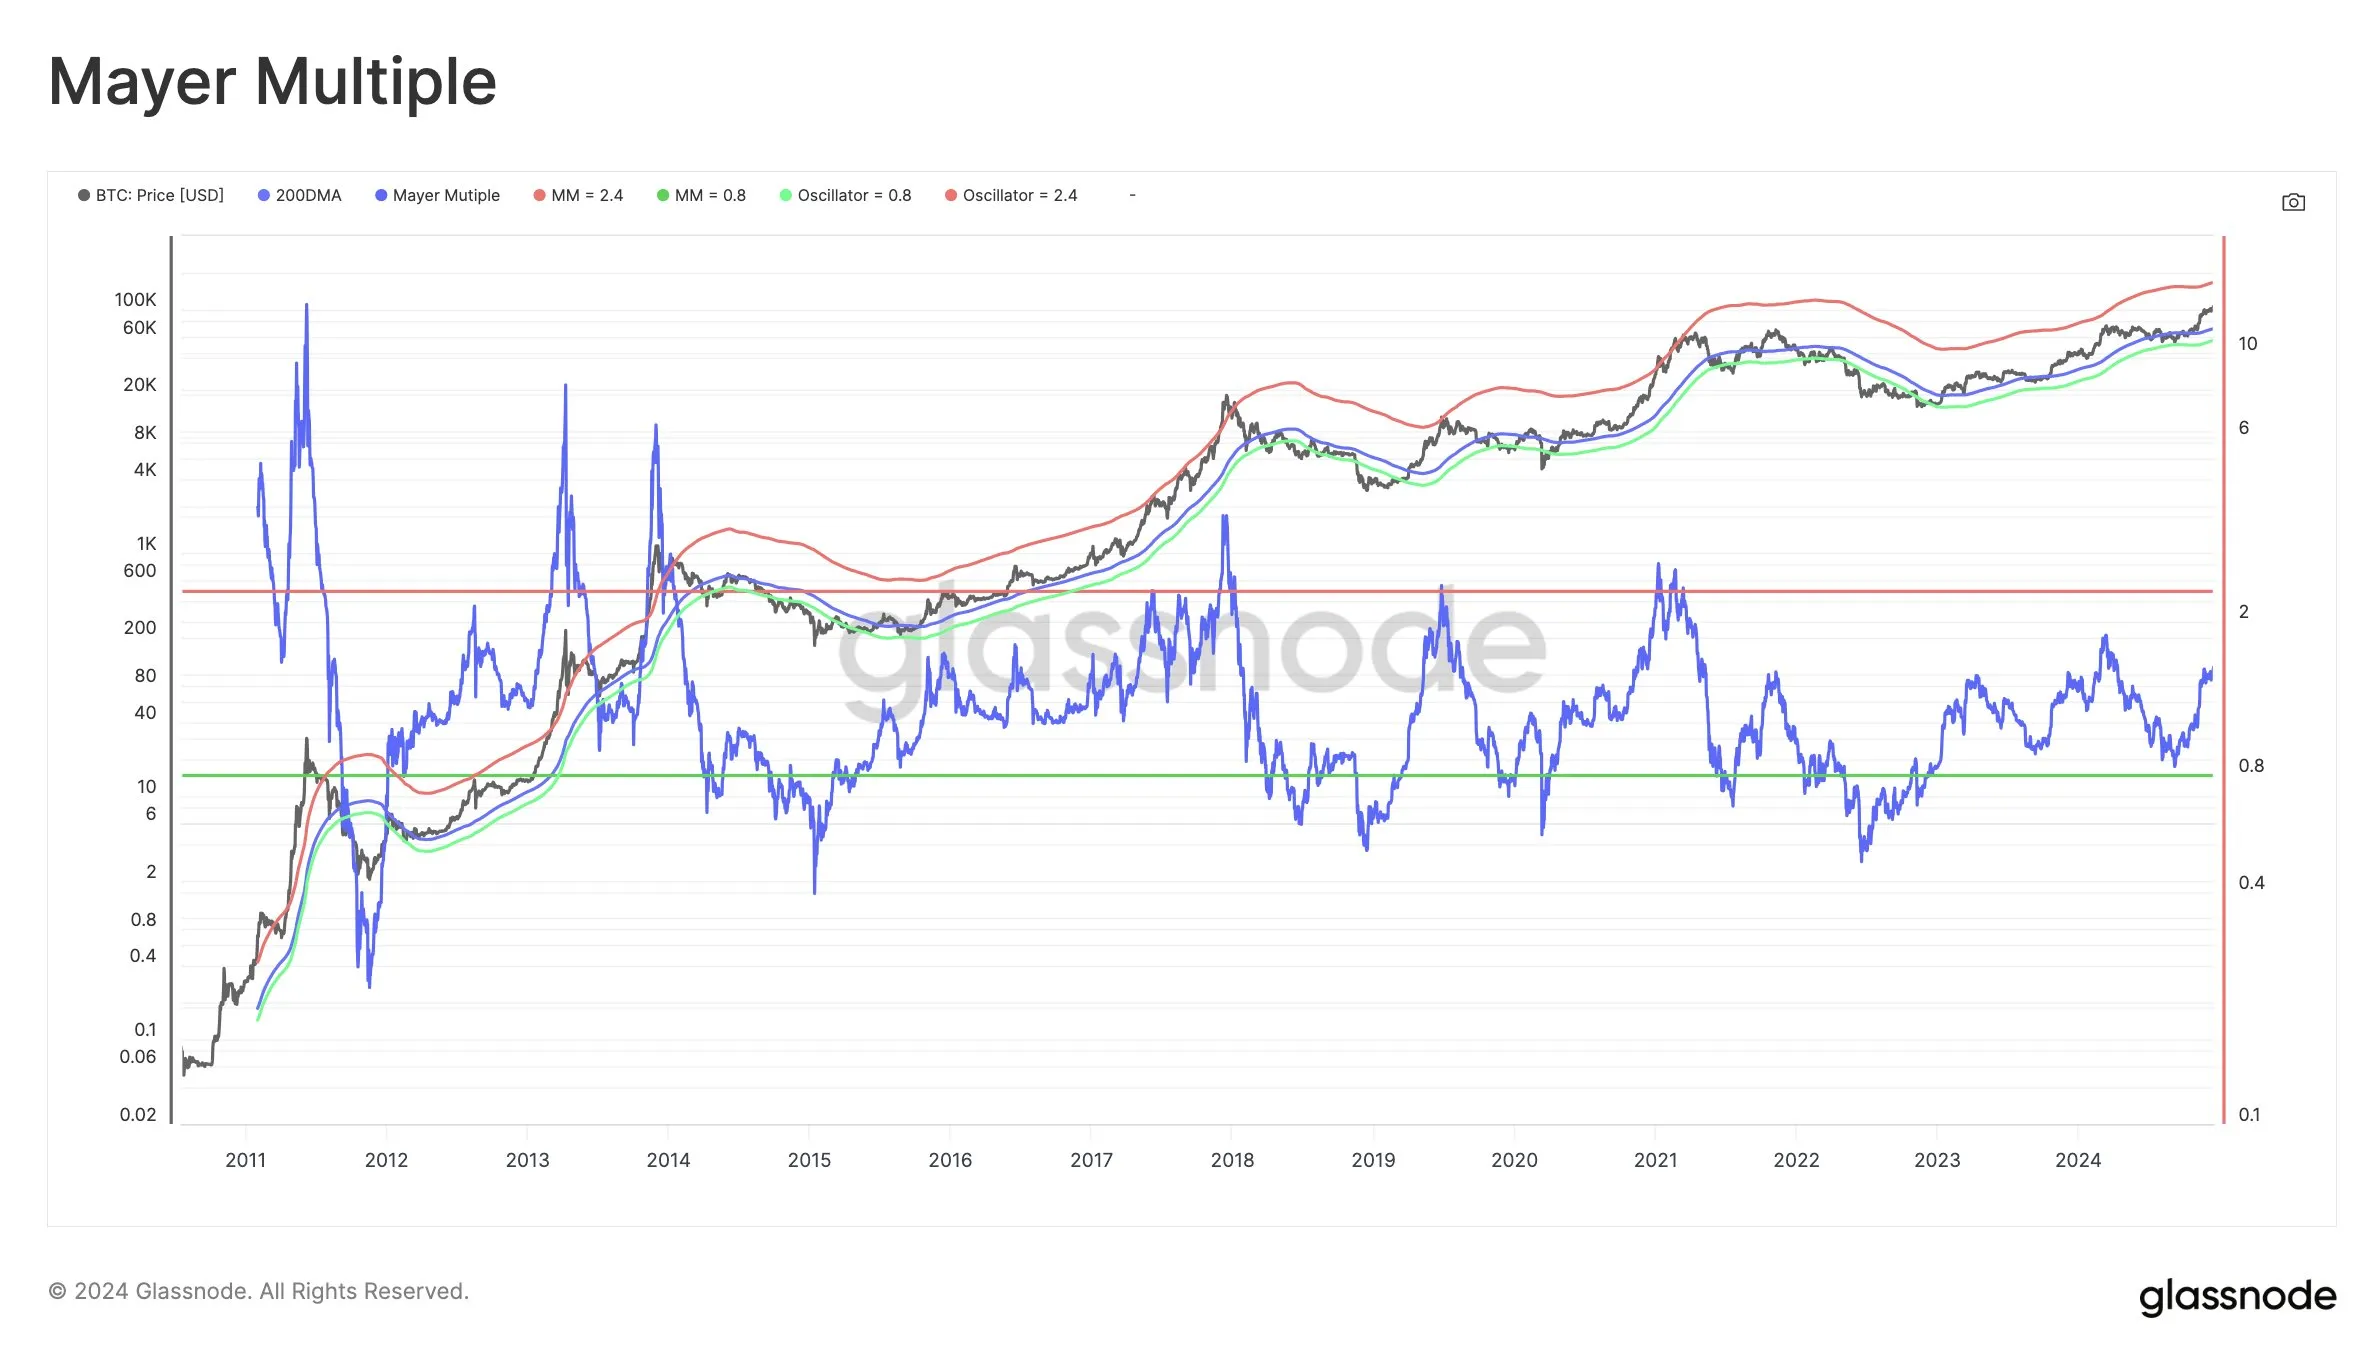
12/ The Mayer Multiple: Currently below the 2.4 threshold linked to overbought conditions, the Mayer Multiple indicates that Bitcoin needs to rise significantly to meet previous cycle highs.
13/ The Cycle Extremes Oscillator Chart: Currently, only half of the tracked conditions for an overheated market are met, suggesting the cycle has not yet peaked.
14/ Pi Cycle Top Indicator: No crossover signals have been triggered, indicating that a classic top signal is absent.
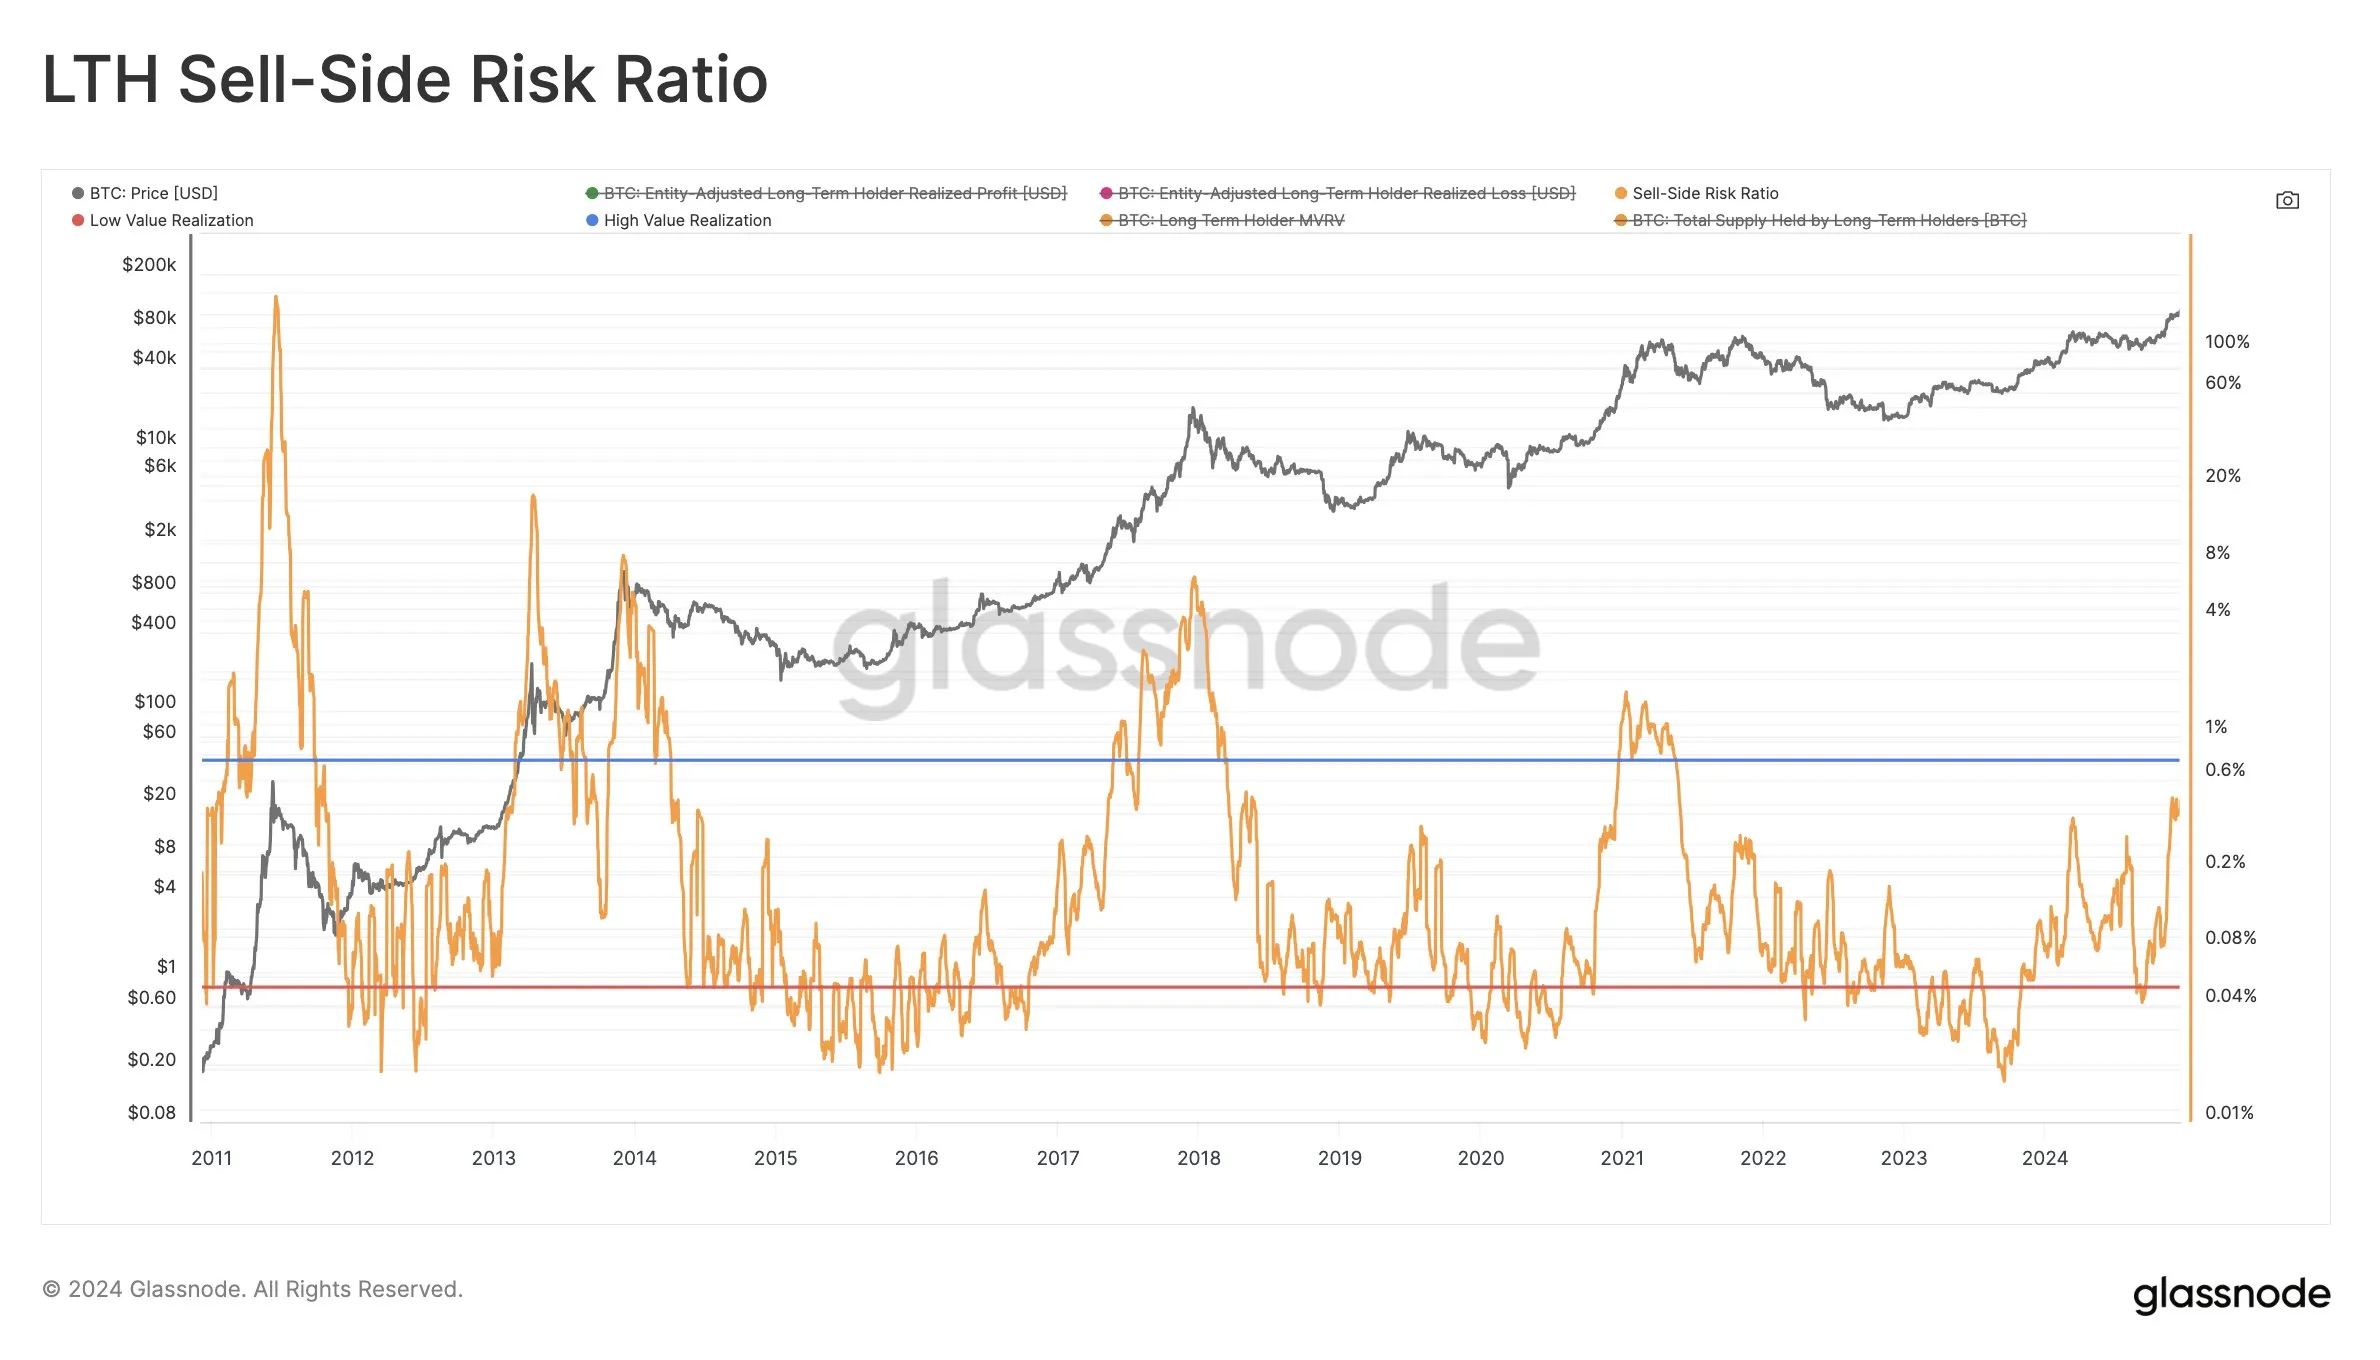
15/ Sell-Side Risk Ratio (LTH Version): Currently at 0.46%, indicating that the market has not yet entered the intense sell pressure zone typical near tops.
16/ LTH Inflation Rate: This metric raises caution, as it may indicate increasing distribution from long-term holders.
17/ STH-SOPR: Although elevated, short-term holders are not showing persistent profit-taking behavior typical of market tops.
18/ SLRV Ribbons: Both moving averages are trending up, indicating no current signal of a market top.
Schultze-Kraft emphasized the importance of using multiple metrics collectively rather than in isolation. He acknowledged that evolving factors in Bitcoin's ecosystem may affect historical comparisons. While many indicators suggest Bitcoin is approaching profitable territory, few have reached levels indicative of previous cycle tops. At press time, Bitcoin traded at $96,037.
