Jun 24, 2025
7 0
BNB Faces Bearish Breakdown While Bullish Flag Pattern Emerges
BNB is currently experiencing conflicting market signals: a bearish breakdown below key support levels and a bullish flag pattern suggesting a possible upward trend. This situation prompts investors to analyze which direction may dominate next.
Key Technical Levels for BNB
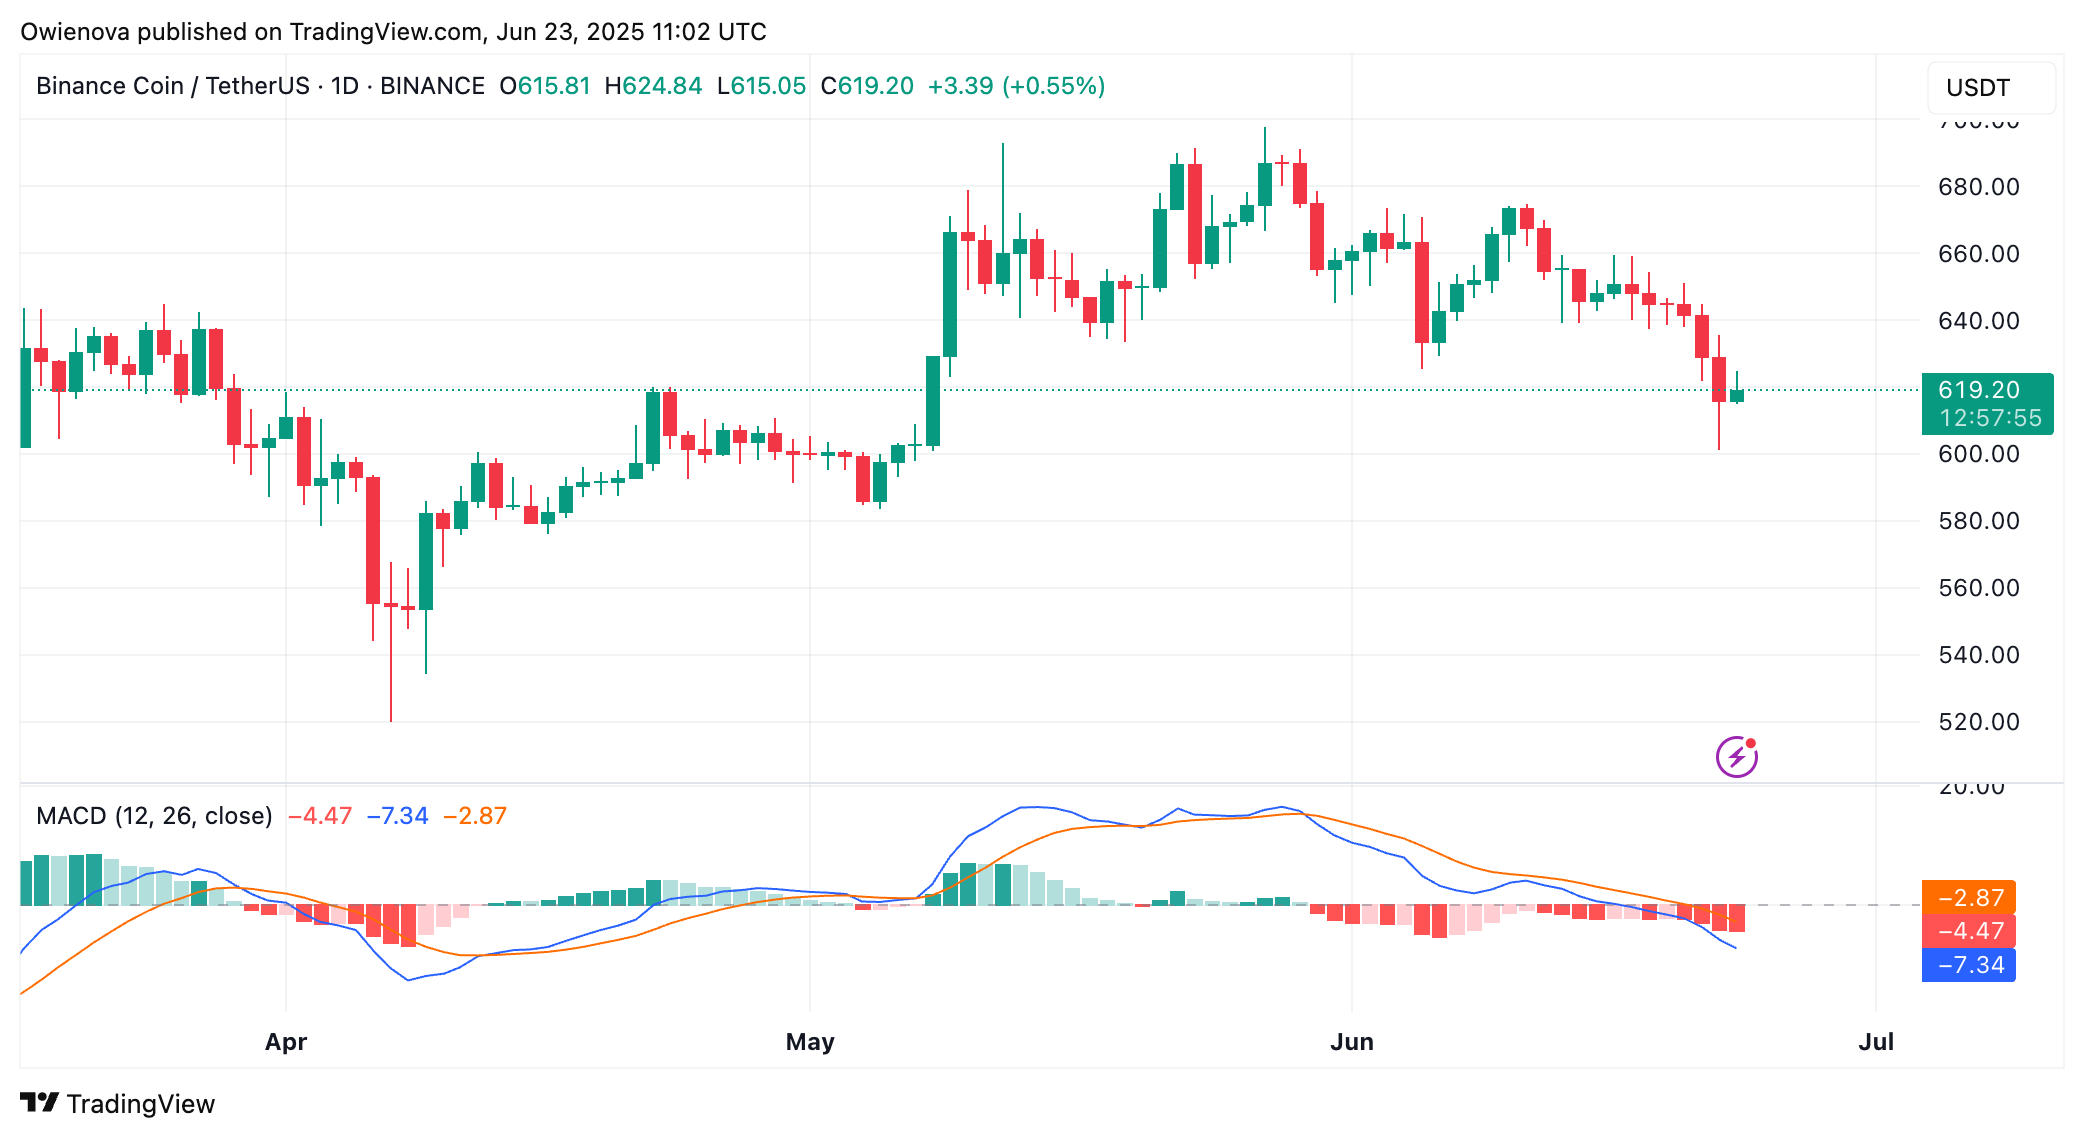
- Current price testing support at $626.95 after dropping below $633.99.
- 200 MA acts as resistance between $642 and $645, with price trading below this moving average.
- Bearish momentum confirmed on the H1 chart, indicating potential further downside if support fails to hold.
Potential Bullish Outlook
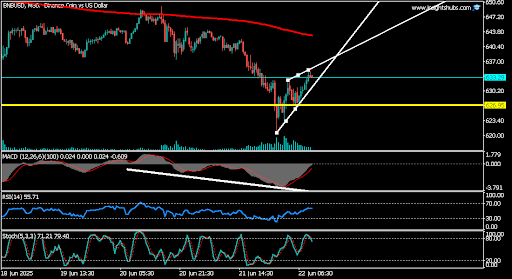
- eL Zippo suggests BNB may rise despite bearish sentiment, citing a bullish flag pattern as a continuation signal.
- Current trading price around $623, with a market capitalization of approximately $87.7 billion.
- 24-hour trading volume at roughly $1.8 billion, with price and volume increases of 2.11% and 13.22%, respectively.