Nov 12, 2025
9 0
BNB Faces Possible Downside Amid Head and Shoulders Pattern Formation
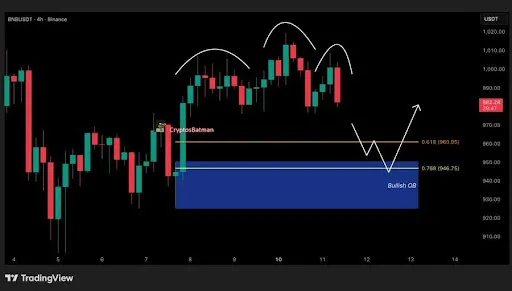
BNB is currently displaying a potential rebound but remains within a head and shoulders (H&S) pattern, which may indicate a future pullback or continuation upward.
Key Technical Indicators
- The H&S pattern on BNB's lower timeframe chart suggests bearish momentum might gain control, indicating a possible downward trend.
- An unfilled Fair Value Gap (FVG) below the current price could attract the market to fill this gap, supporting the likelihood of a downturn.
- The anticipated pullback aligns with a key Fibonacci level and a major Order Block (OB), highlighting a strategic entry point for long positions.
Market Strength and Potential Recovery
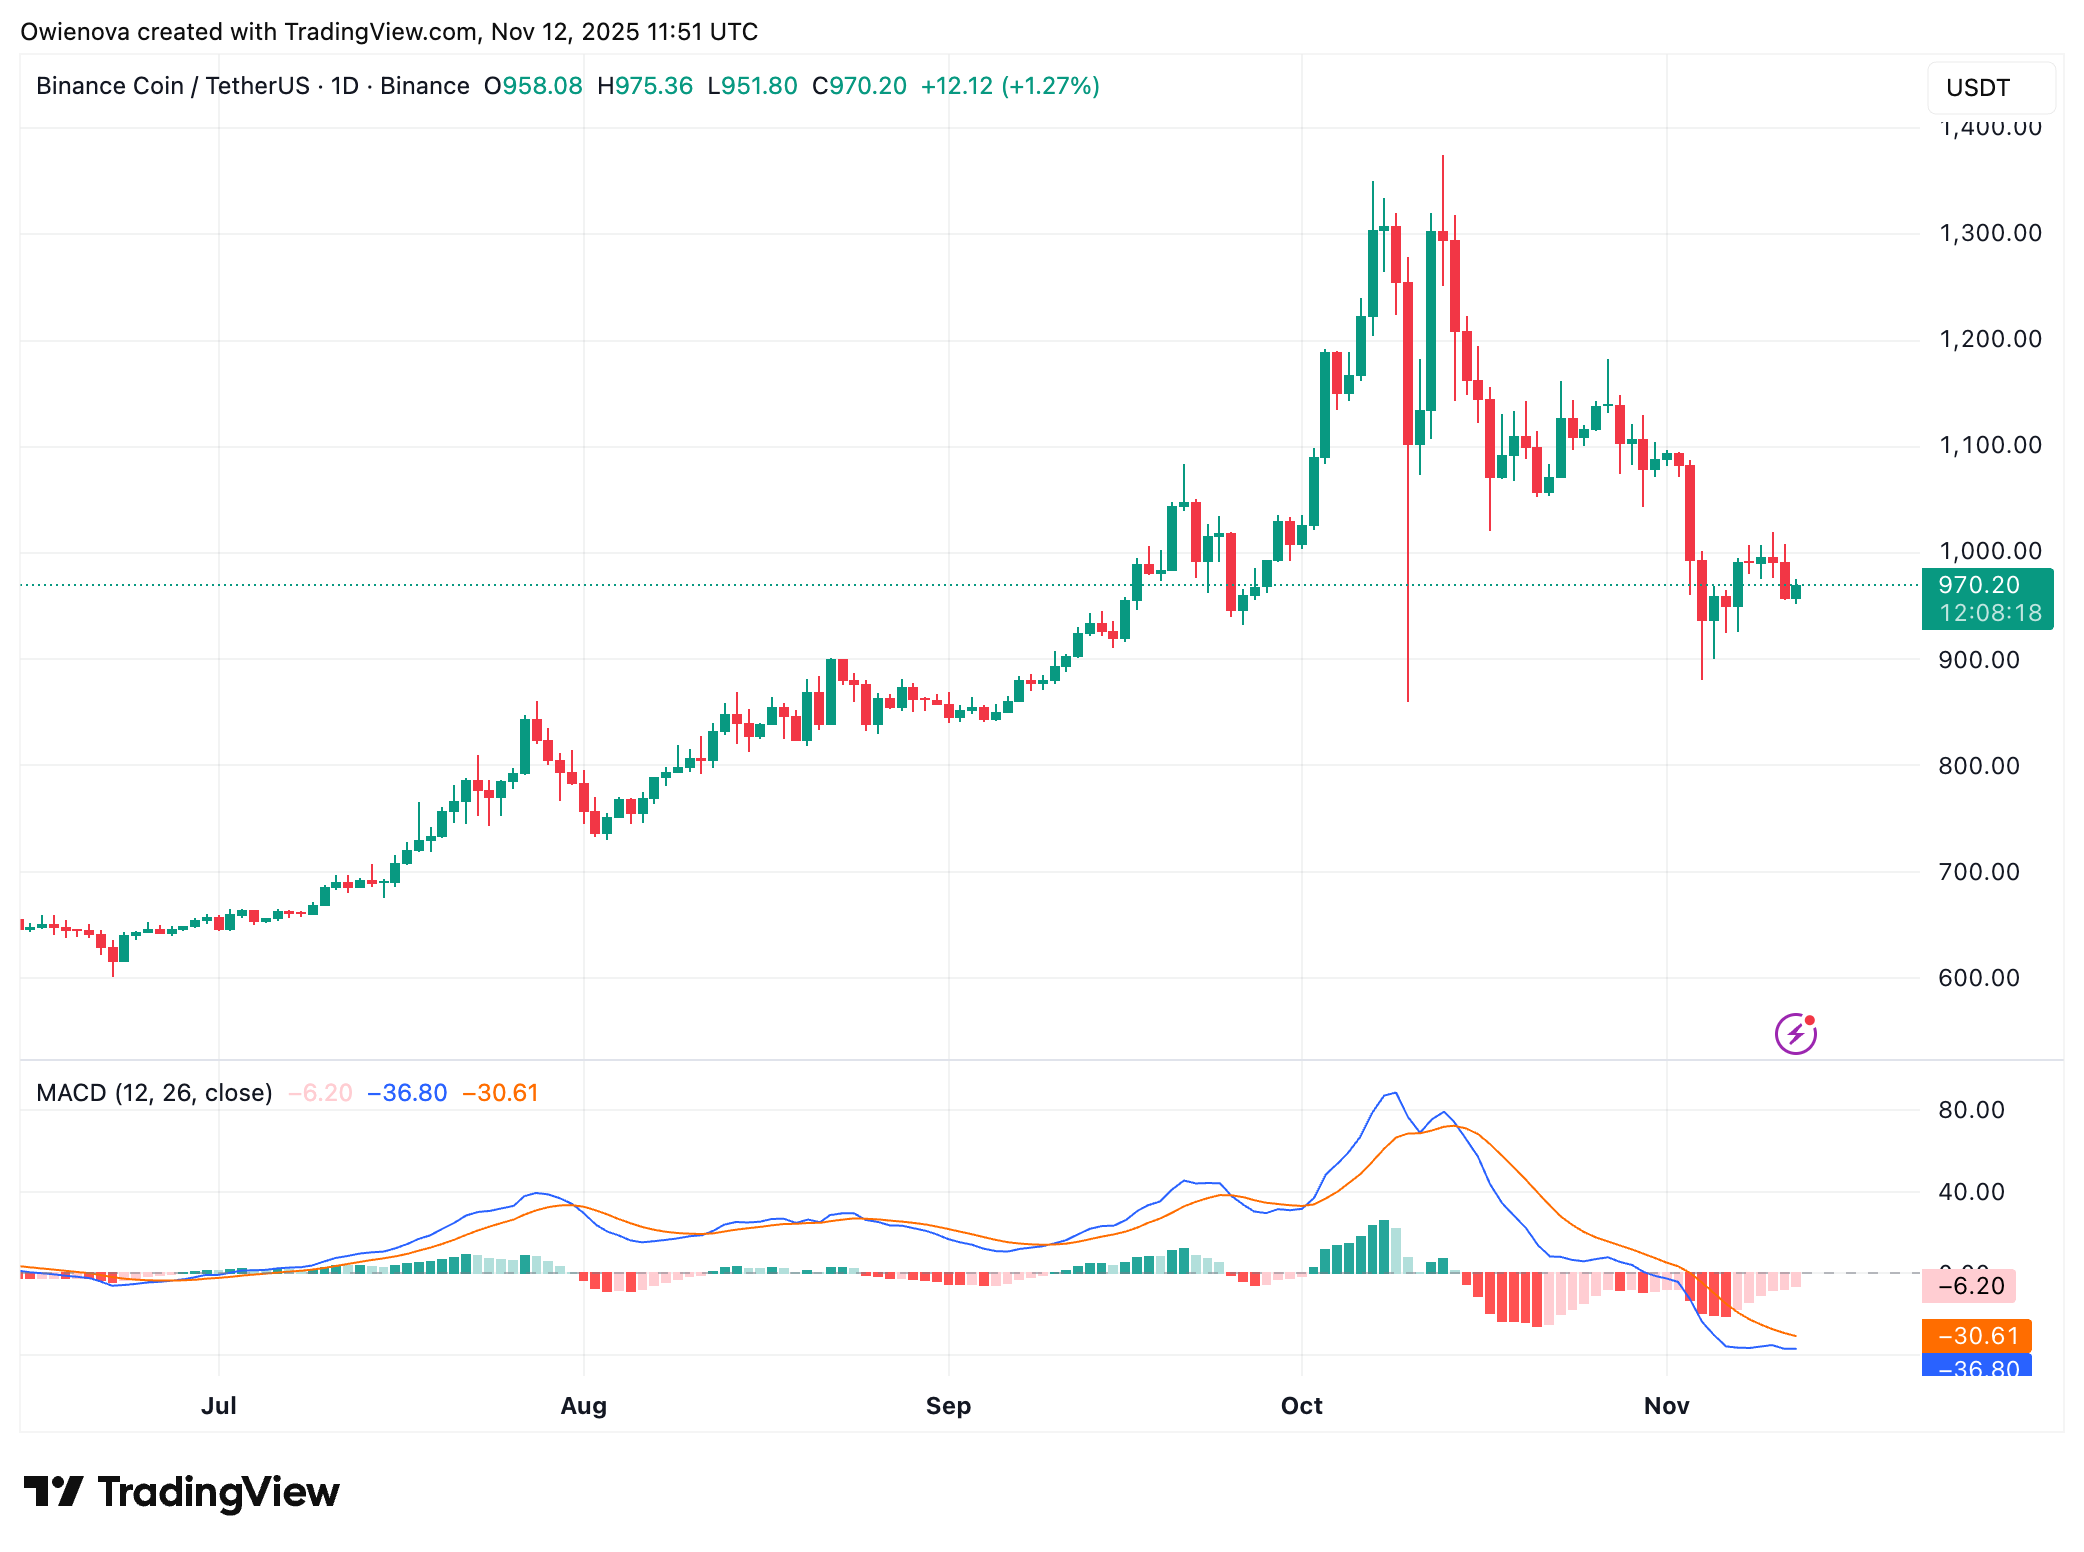
- BNB has possibly formed a significant low around the $864 level after a prolonged downtrend and consolidation phase, indicating a crucial accumulation zone.
- Stability near the $950 level shows signs of gradual recovery as buying pressure builds.
- If the $950 support holds, BNB could rebound toward the $1,050–$1,100 range, potentially marking the start of a medium-term uptrend.