BNB Price Consolidates Below $700 Amid Bearish Signs
BNB price is consolidating near the $700 support zone, showing some bearish signs while bulls remain active near the $672 support.
- BNB struggles to clear the $720 resistance.
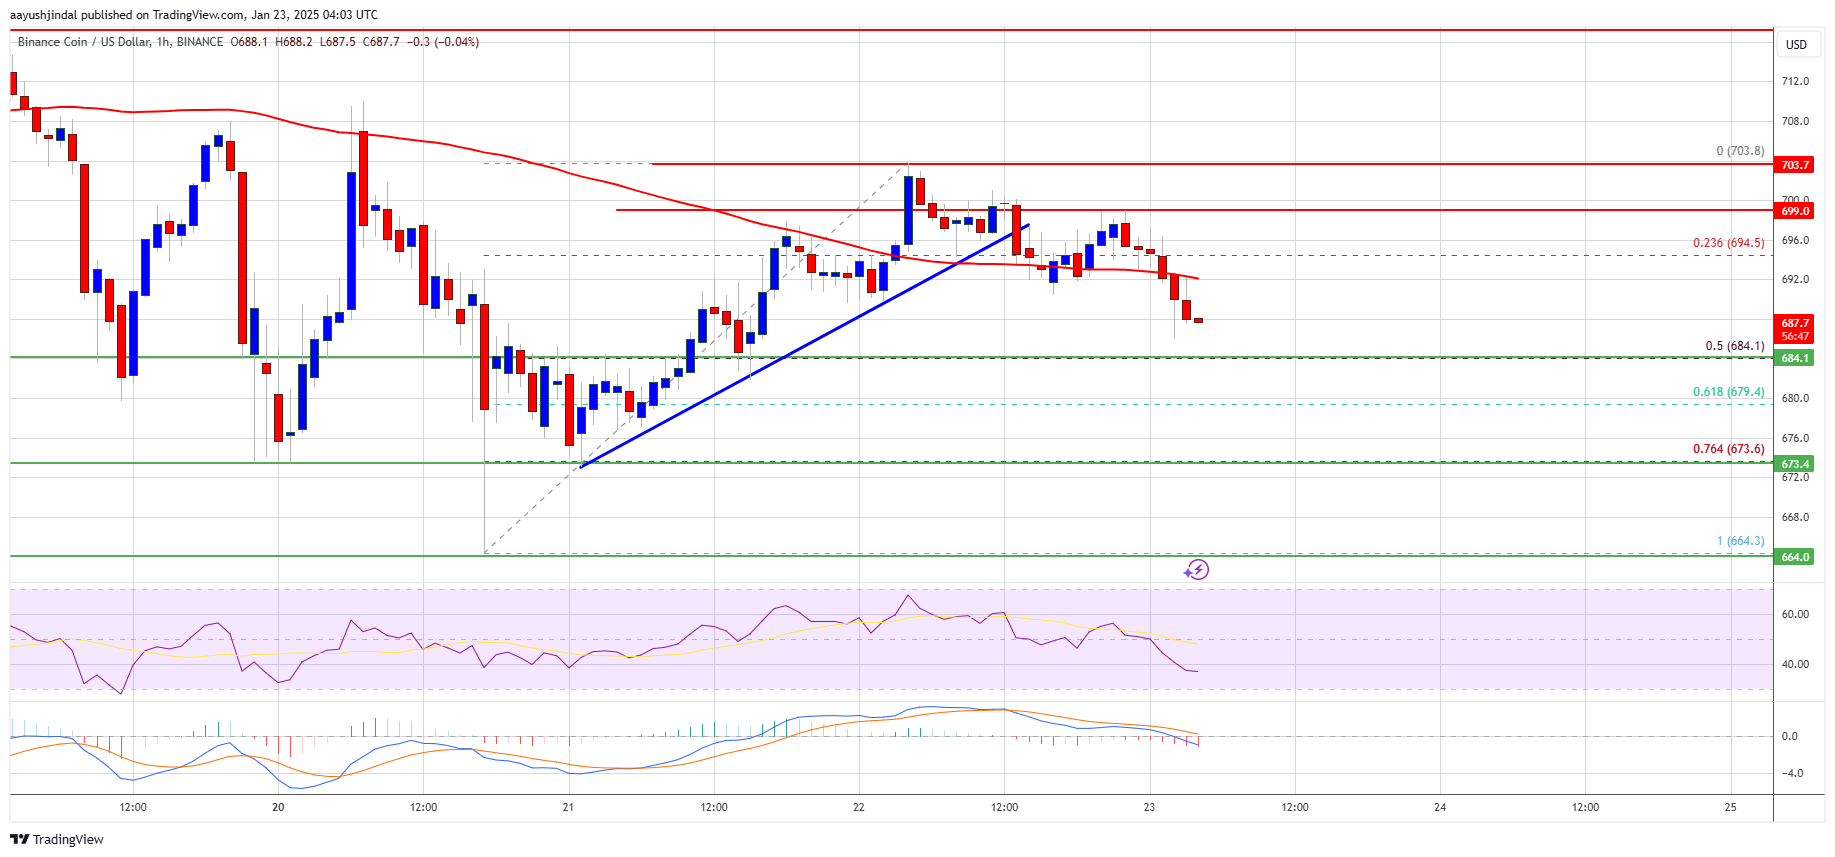
- Currently trading below $700 and the 100-hourly simple moving average.
- Break below key bullish trend line with support at $696 on the hourly chart.
- Must stay above $672 to initiate a potential increase.
Current Price Dynamics
After an increase, BNB struggled to hold above $705 and started to pull back from a high of $703. A drop below the $695 support occurred, approaching the 50% Fib retracement level from $664 to $703.
If BNB increases, it may face resistance near $692 and $696. A move above $696 could lead to testing $700 and potentially $720. Further gains might reach $732.
Potential Downside Risks
If BNB does not clear $696, it could decline, with initial support near $685 and major support at $680 and $672 (76.4% Fib retracement). A break below $692 may lead to further losses toward $675.
Technical Indicators
- Hourly MACD indicates bullish momentum.
- Hourly RSI is below the 50 level.
- Major Support Levels: $685 and $672.
- Major Resistance Levels: $696 and $700.