Jun 18, 2025
5 0
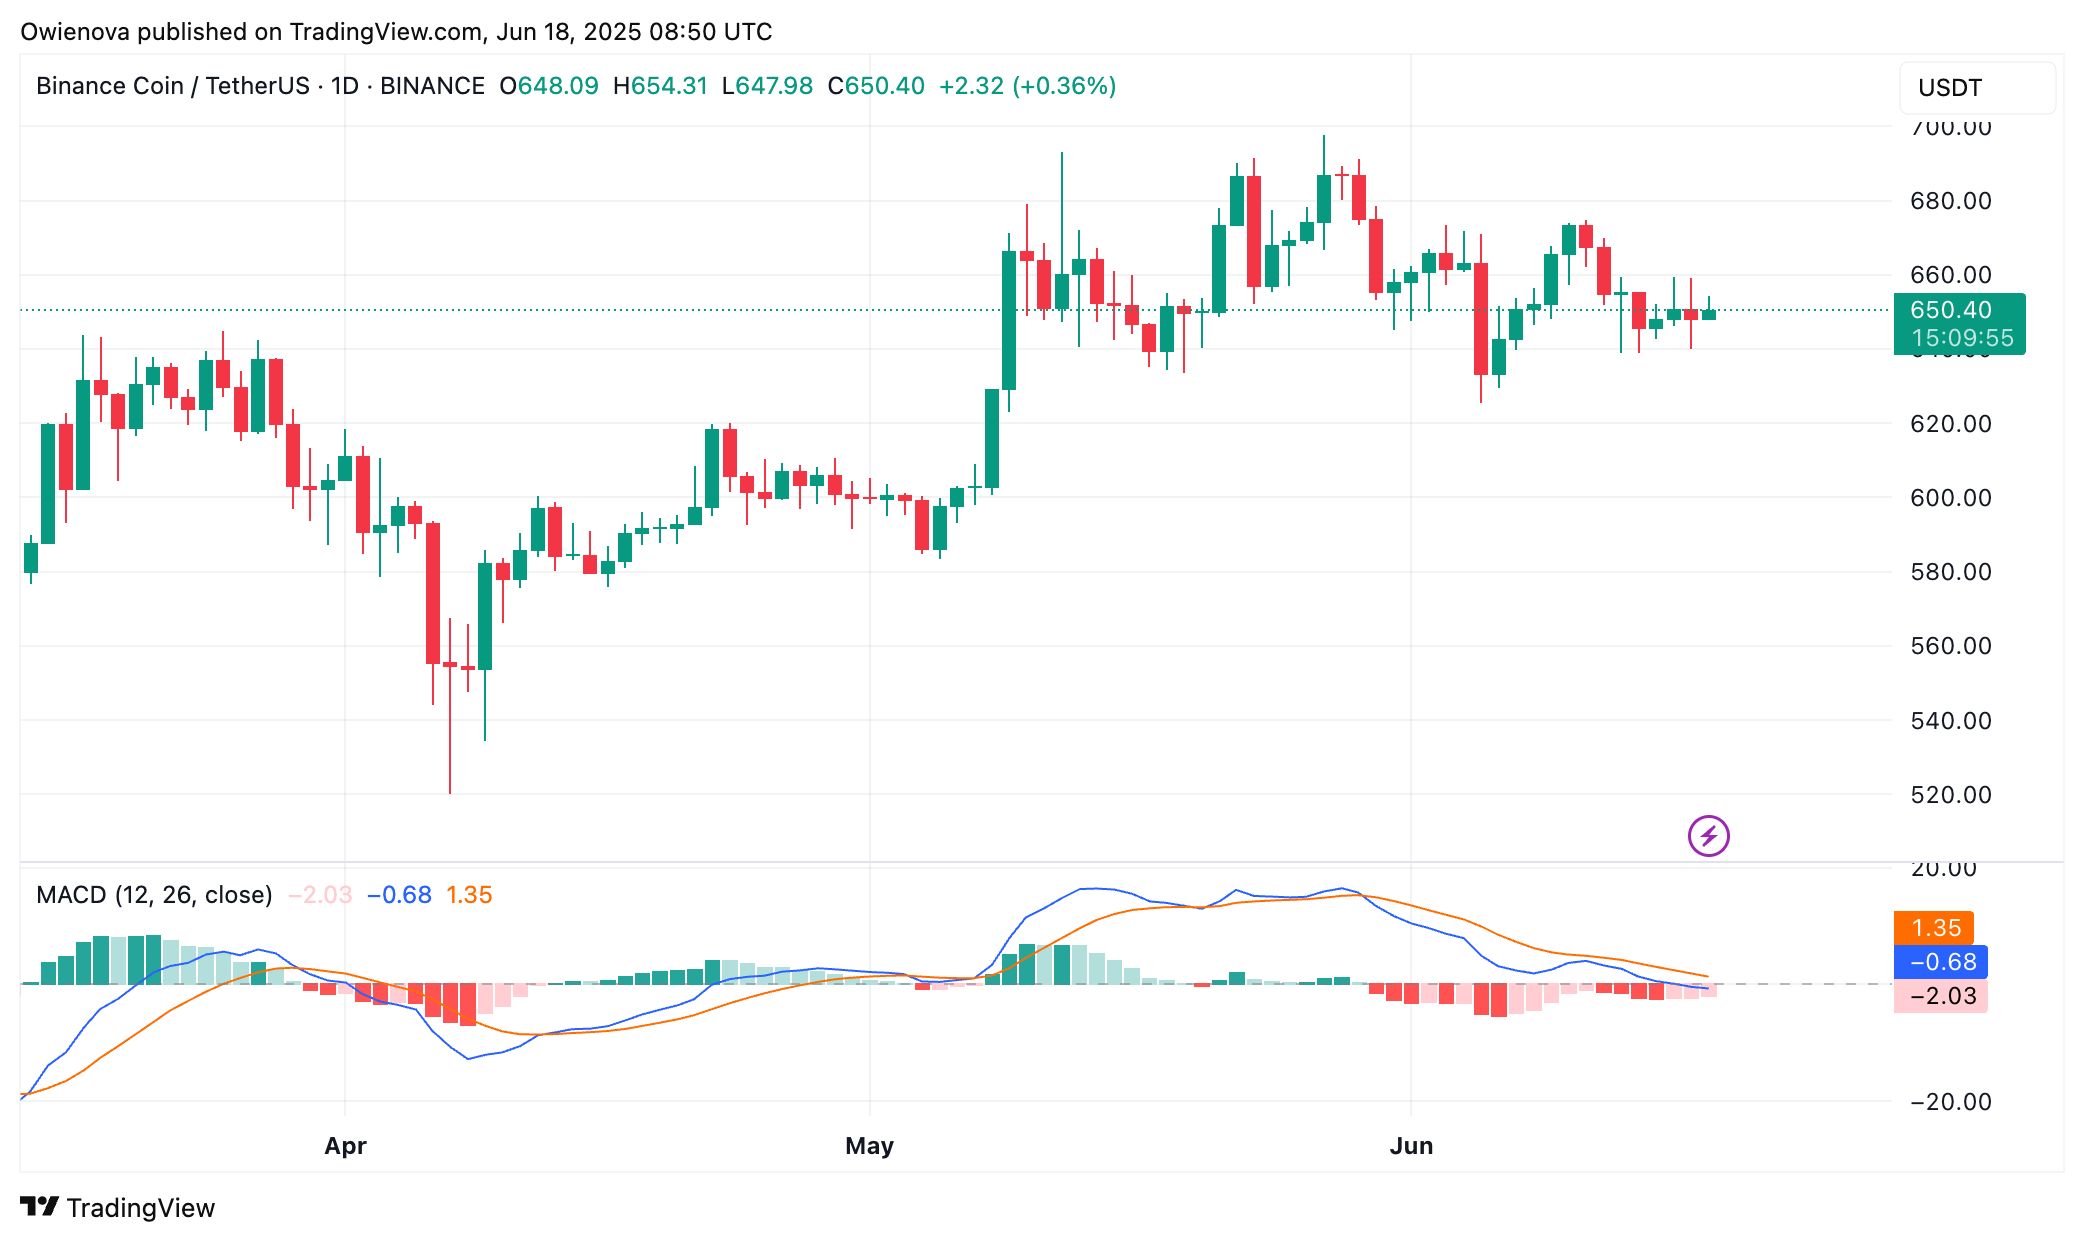
BNB Price Tests Resistance at $653 Amidst Consolidation Phase
BNB is currently at a critical juncture, with price action consolidating between two significant technical areas. The cryptocurrency is testing resistance near the 200-period moving average around $653 while maintaining support at $640.
Resistance and Support Levels
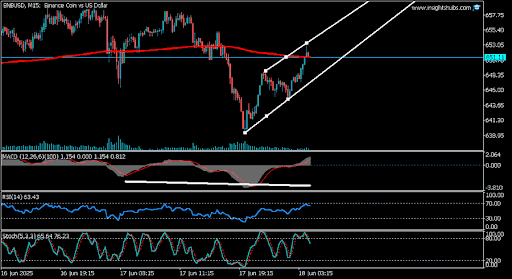
- Price is testing resistance near $651.50, marked by a horizontal line.
- Support remains strong at $640, providing a safety net for bulls.
- The 200 MA acts as dynamic resistance, hindering upward movements.
Market Indicators
- MACD shows negative values indicating ongoing bearish pressure.
- RSI has started to recover from oversold conditions, suggesting potential short-term bounce.
Chart Analysis
- M30 chart indicates price trading at $650.10, below the 200 MA, reflecting buyer-seller tension.
- H1 chart suggests an underlying bullish bias within a broader ascending channel.
- Immediate resistance is located at $653; breaking this could lead to upward momentum towards $657.
- If unable to break $653, a retreat to support at $640 is probable.