BNB Surges Past $724, Indicating Strong Bullish Momentum
BNB has recently surged past the $724 resistance level, indicating potential for further growth. This breakout has generated bullish momentum, leading to speculation about the token's capacity for increased value. Strong market sentiment and heightened trading activity suggest that BNB may continue its upward trajectory.
This article investigates BNB’s recent performance above the $724 threshold, analyzing the key drivers of its bullish strength. It assesses the sustainability of this upward movement through technical indicators, market sentiment, and potential resistance zones.
BNB Breaks $724: A Key Milestone For The Bulls
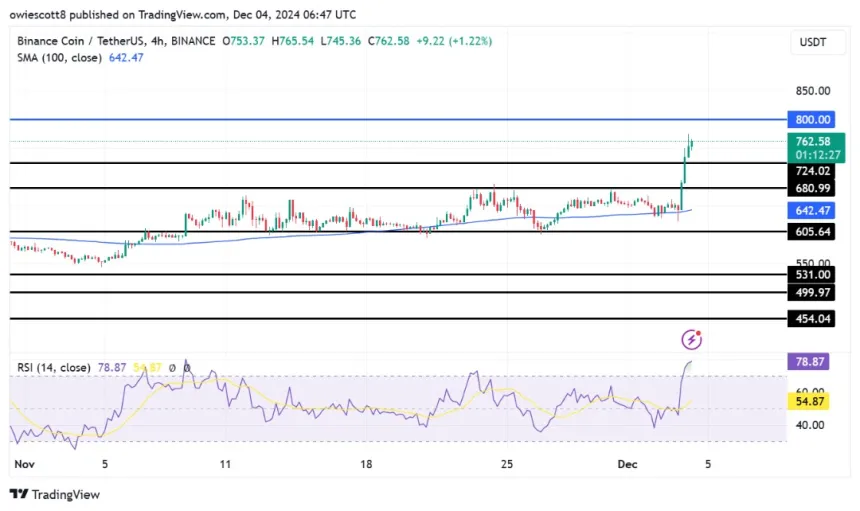
On the 4-hour chart, BNB is above the 100-day Simple Moving Average (SMA), indicating a current bullish trend. This position reflects underlying strength and positive market sentiment, with traders optimistic about new highs.

The 4-hour Relative Strength Index (RSI) shows significant improvement, rising to 78% after recovering from a low of 46%. This increase indicates strong bullish momentum driven by intensified buying pressure, suggesting a shift in market sentiment.
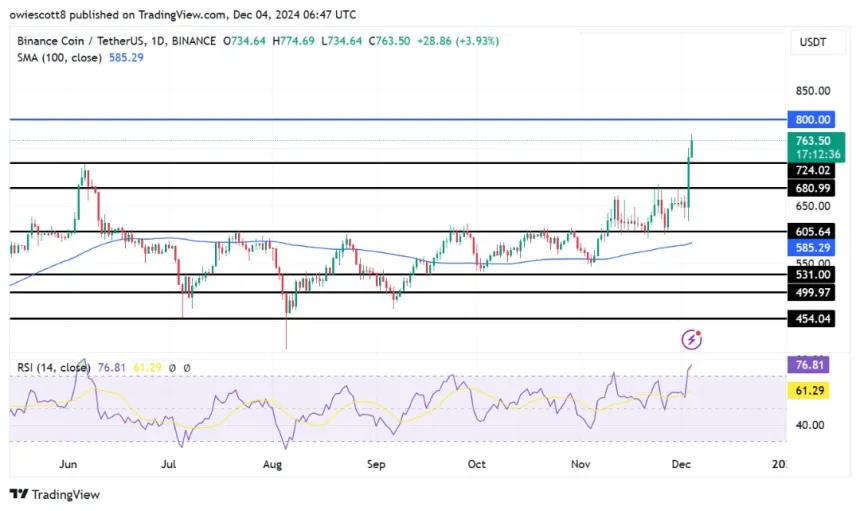
The daily chart supports BNB's upward momentum with bullish candlesticks forming as prices exceed $724. This trend reinforces market confidence and indicates the possibility of continued gains.

The daily RSI recently reached 76%, placing BNB in overbought territory. While this indicates strong buying pressure, it also suggests the asset may be overheating.
Can The Bulls Sustain The Momentum Beyond $724?
With BNB surpassing the $724 level, the primary question is whether this bullish trend can continue. If buying pressure remains robust, BNB could target new highs, with $800 identified as a significant next target.
If momentum falters, BNB may decline toward the $724 support level. A drop below this threshold could lead to further declines, testing additional support zones.
