Apr 18, 2025
1 0
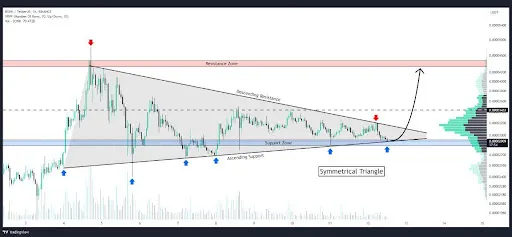
BONK Forms Symmetrical Triangle Pattern Indicating Potential Price Breakout
Bonk (BONK) is forming a symmetrical triangle pattern, indicating a potential price breakout. Key points include:
- The pattern features converging trendlines with lower highs and higher lows.
- A breakout above the upper trendline could lead to gains of 70–80%.
- Recent price action shows a rebound from the lower support trendline, suggesting buyer interest.
- Volume confirmation is crucial to avoid false breakouts.
- Symmetrical triangles are neutral; a breakdown is possible if resistance isn't surpassed.
Current analysis indicates:
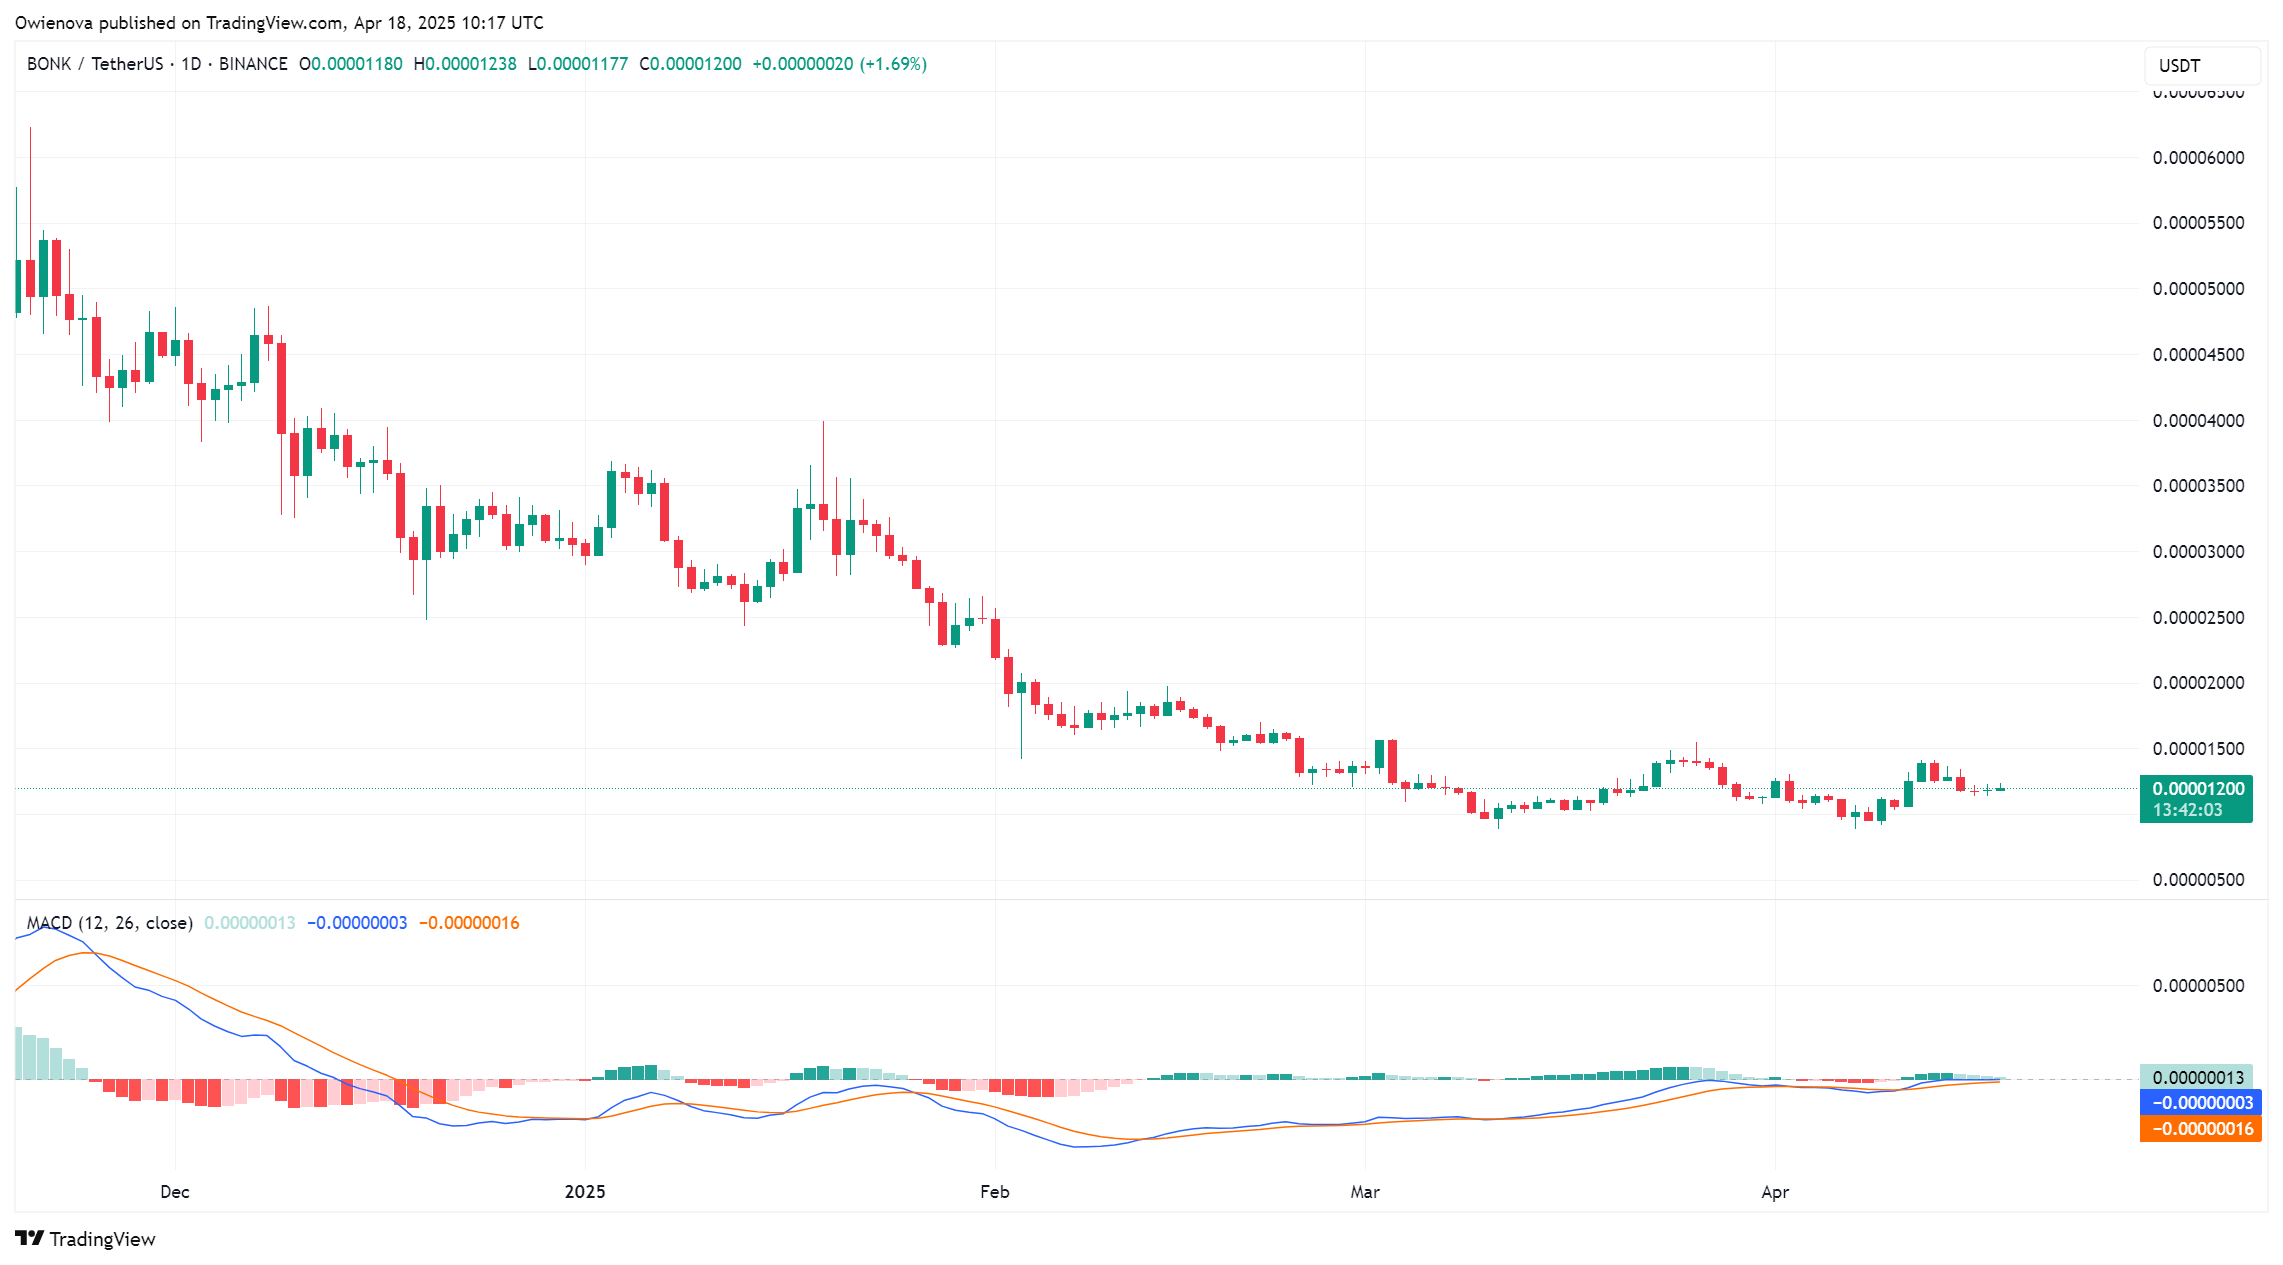
- Bonk's price movement is at a critical stage.
- Traders should monitor volume and key breakout levels for direction confirmation.
- The next candles on the 1-hour chart will be pivotal in determining Bonk's trajectory.