Oct 14, 2025
22 0
Peter Brandt Turns Bullish on XRP After Recent Market Drop
Veteran chartist Peter Brandt has revised his outlook on XRP, turning bullish after initially identifying it as a short target. Recent market activity shows XRP's price fluctuating significantly, with a drop to $1.55 on October 10 followed by a rebound into the mid-$2 range.
Brandt's Technical Analysis
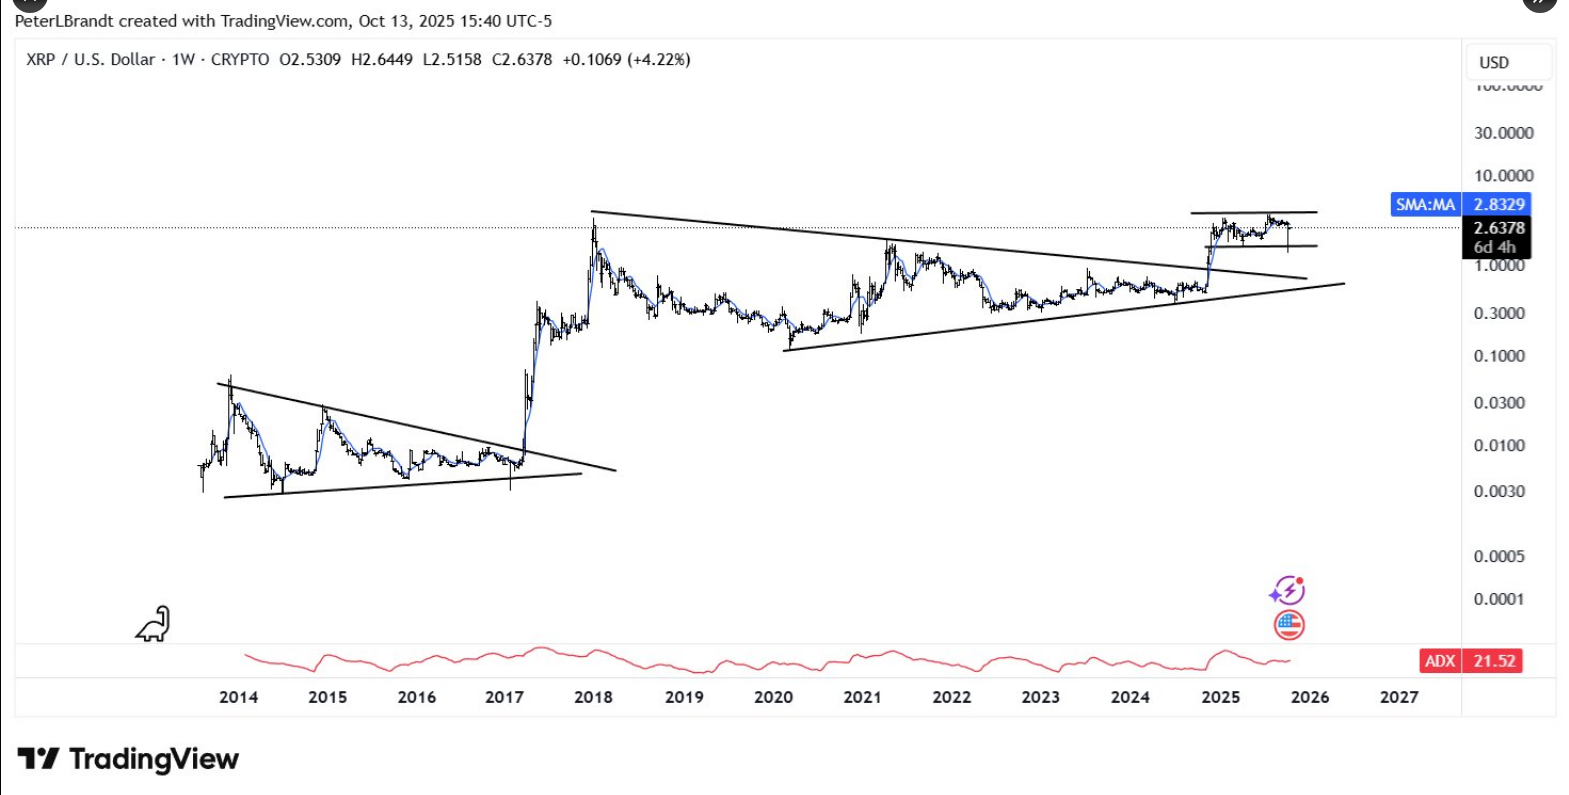
- Brandt shared a long-term chart indicating historical patterns of XRP's price movements, including a symmetrical triangle breakout in 2017 that led to a peak of $3.30 in January 2018.
- The recent breakout in November 2024 pushed XRP into a parallel channel, where prices oscillate back and forth.
- XRP tested the lower line of this channel during the recent crash, rebounding from that support.
- Current trading shows XRP near $2.64, below its simple moving average of $2.83, indicating potential for further correction.
- The Average Directional Index stands at 21.5, suggesting a forming but weak trend.
On-Chain Analysis
- The Spent Output Profit Ratio (SOPR) for XRP dropped to its lowest in six months, signaling that many holders sold at a loss during the recent crash.
- A previous SOPR drop in April saw a subsequent price increase of 35% from $1.90 to $2.58.
Market Levels
- A weekly close above $3 would indicate renewed strength for XRP.
- Resistance is expected around $3.6, coinciding with a July 2025 peak.
- Support levels are identified around $0.8 to $1.5, with potential for further decline if these supports fail.
As the market navigates these technical signals, investors are advised to monitor key support and resistance levels for potential opportunities or risks.