Sep 18, 2025
4 0
Bitcoin Price Struggles Against $117,250 Resistance Zone
Bitcoin Price Analysis
- Bitcoin is experiencing an upward movement, surpassing $116,200.
- The price remains below the 100 hourly Simple Moving Average at $116,200.
- A crucial bullish trend line offers support around $115,500 on the BTC/USD hourly chart.
- To continue its ascent, Bitcoin needs to overcome the $117,250 resistance zone.
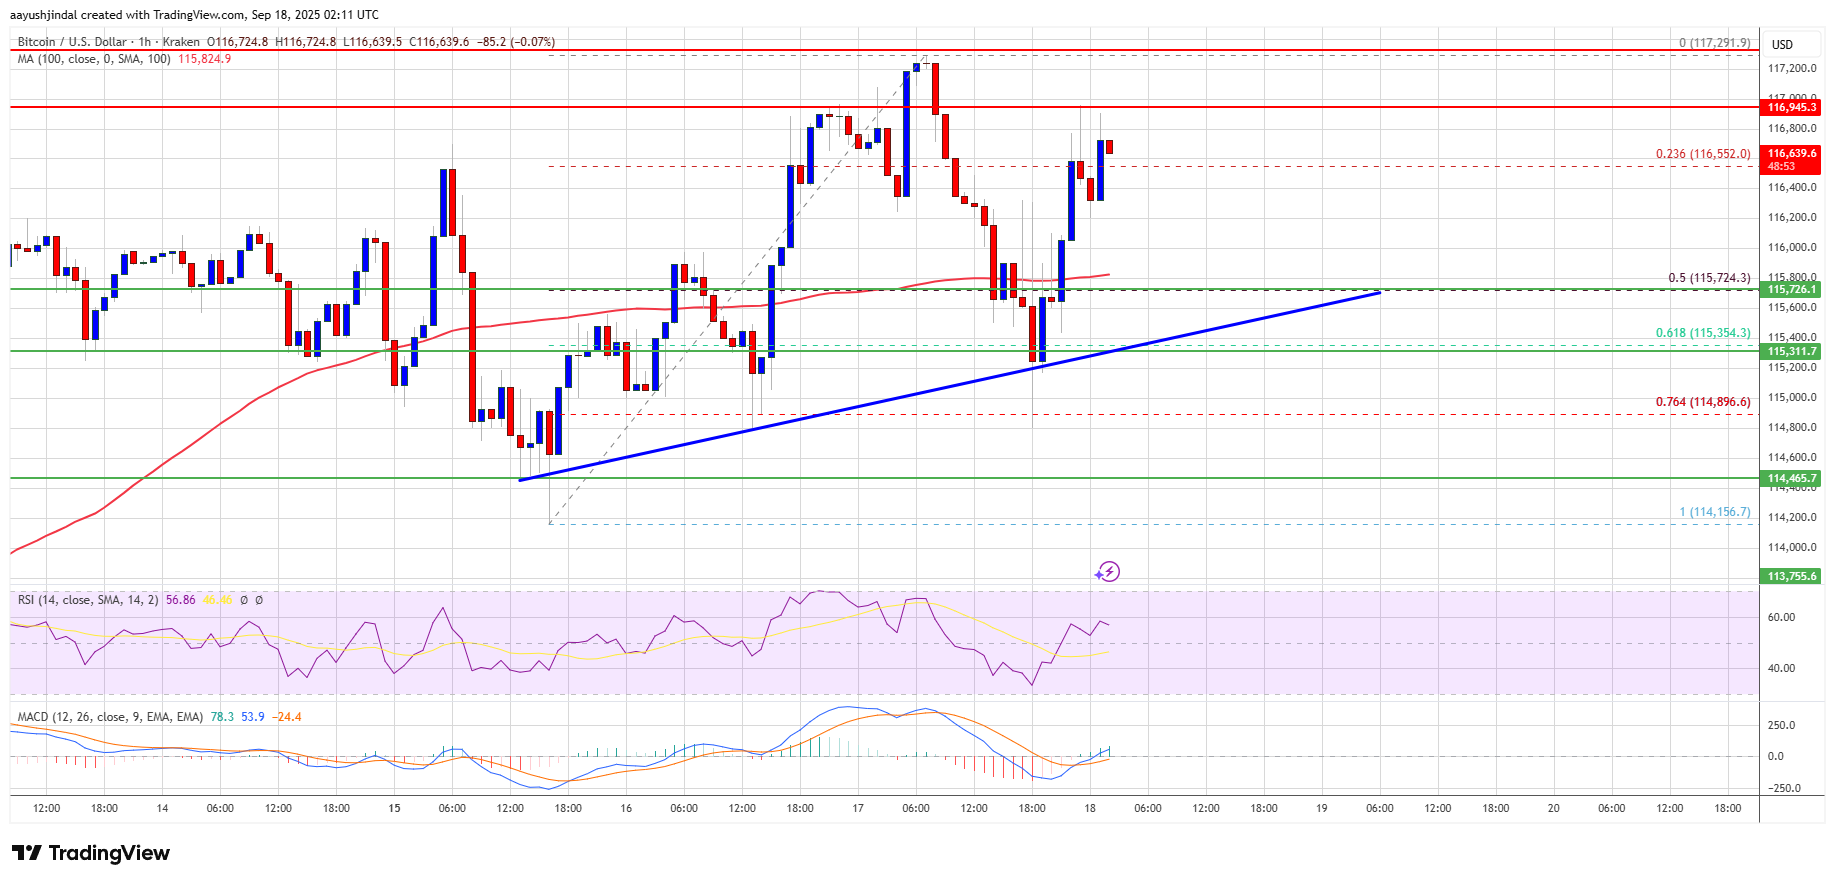
Key Resistance and Support Levels
- Immediate resistance levels are at $116,950 and $117,250. Further resistance could be at $117,800, $118,500, and potentially $118,800.
- If unable to breach $117,250, Bitcoin may decline, with initial support at $116,200 and $115,500.
- Further declines might target supports at $115,000, $114,500, and a major support at $112,500.
Technical Indicators
- The hourly MACD indicates a strengthening bullish trend.
- The hourly RSI for BTC/USD is above 50, suggesting positive momentum.