4 0
Bitcoin Rally Toward $120K Faces Resistance Near $115K
Bitcoin (BTC) Trends and Market Analysis
- Bitcoin has broken out of an inverse head-and-shoulders pattern, suggesting a potential rally toward $120,000.
- BTC's price is above the 50-day SMA, indicating bullish momentum. The GMMA indicator hints at a possible bull cross.
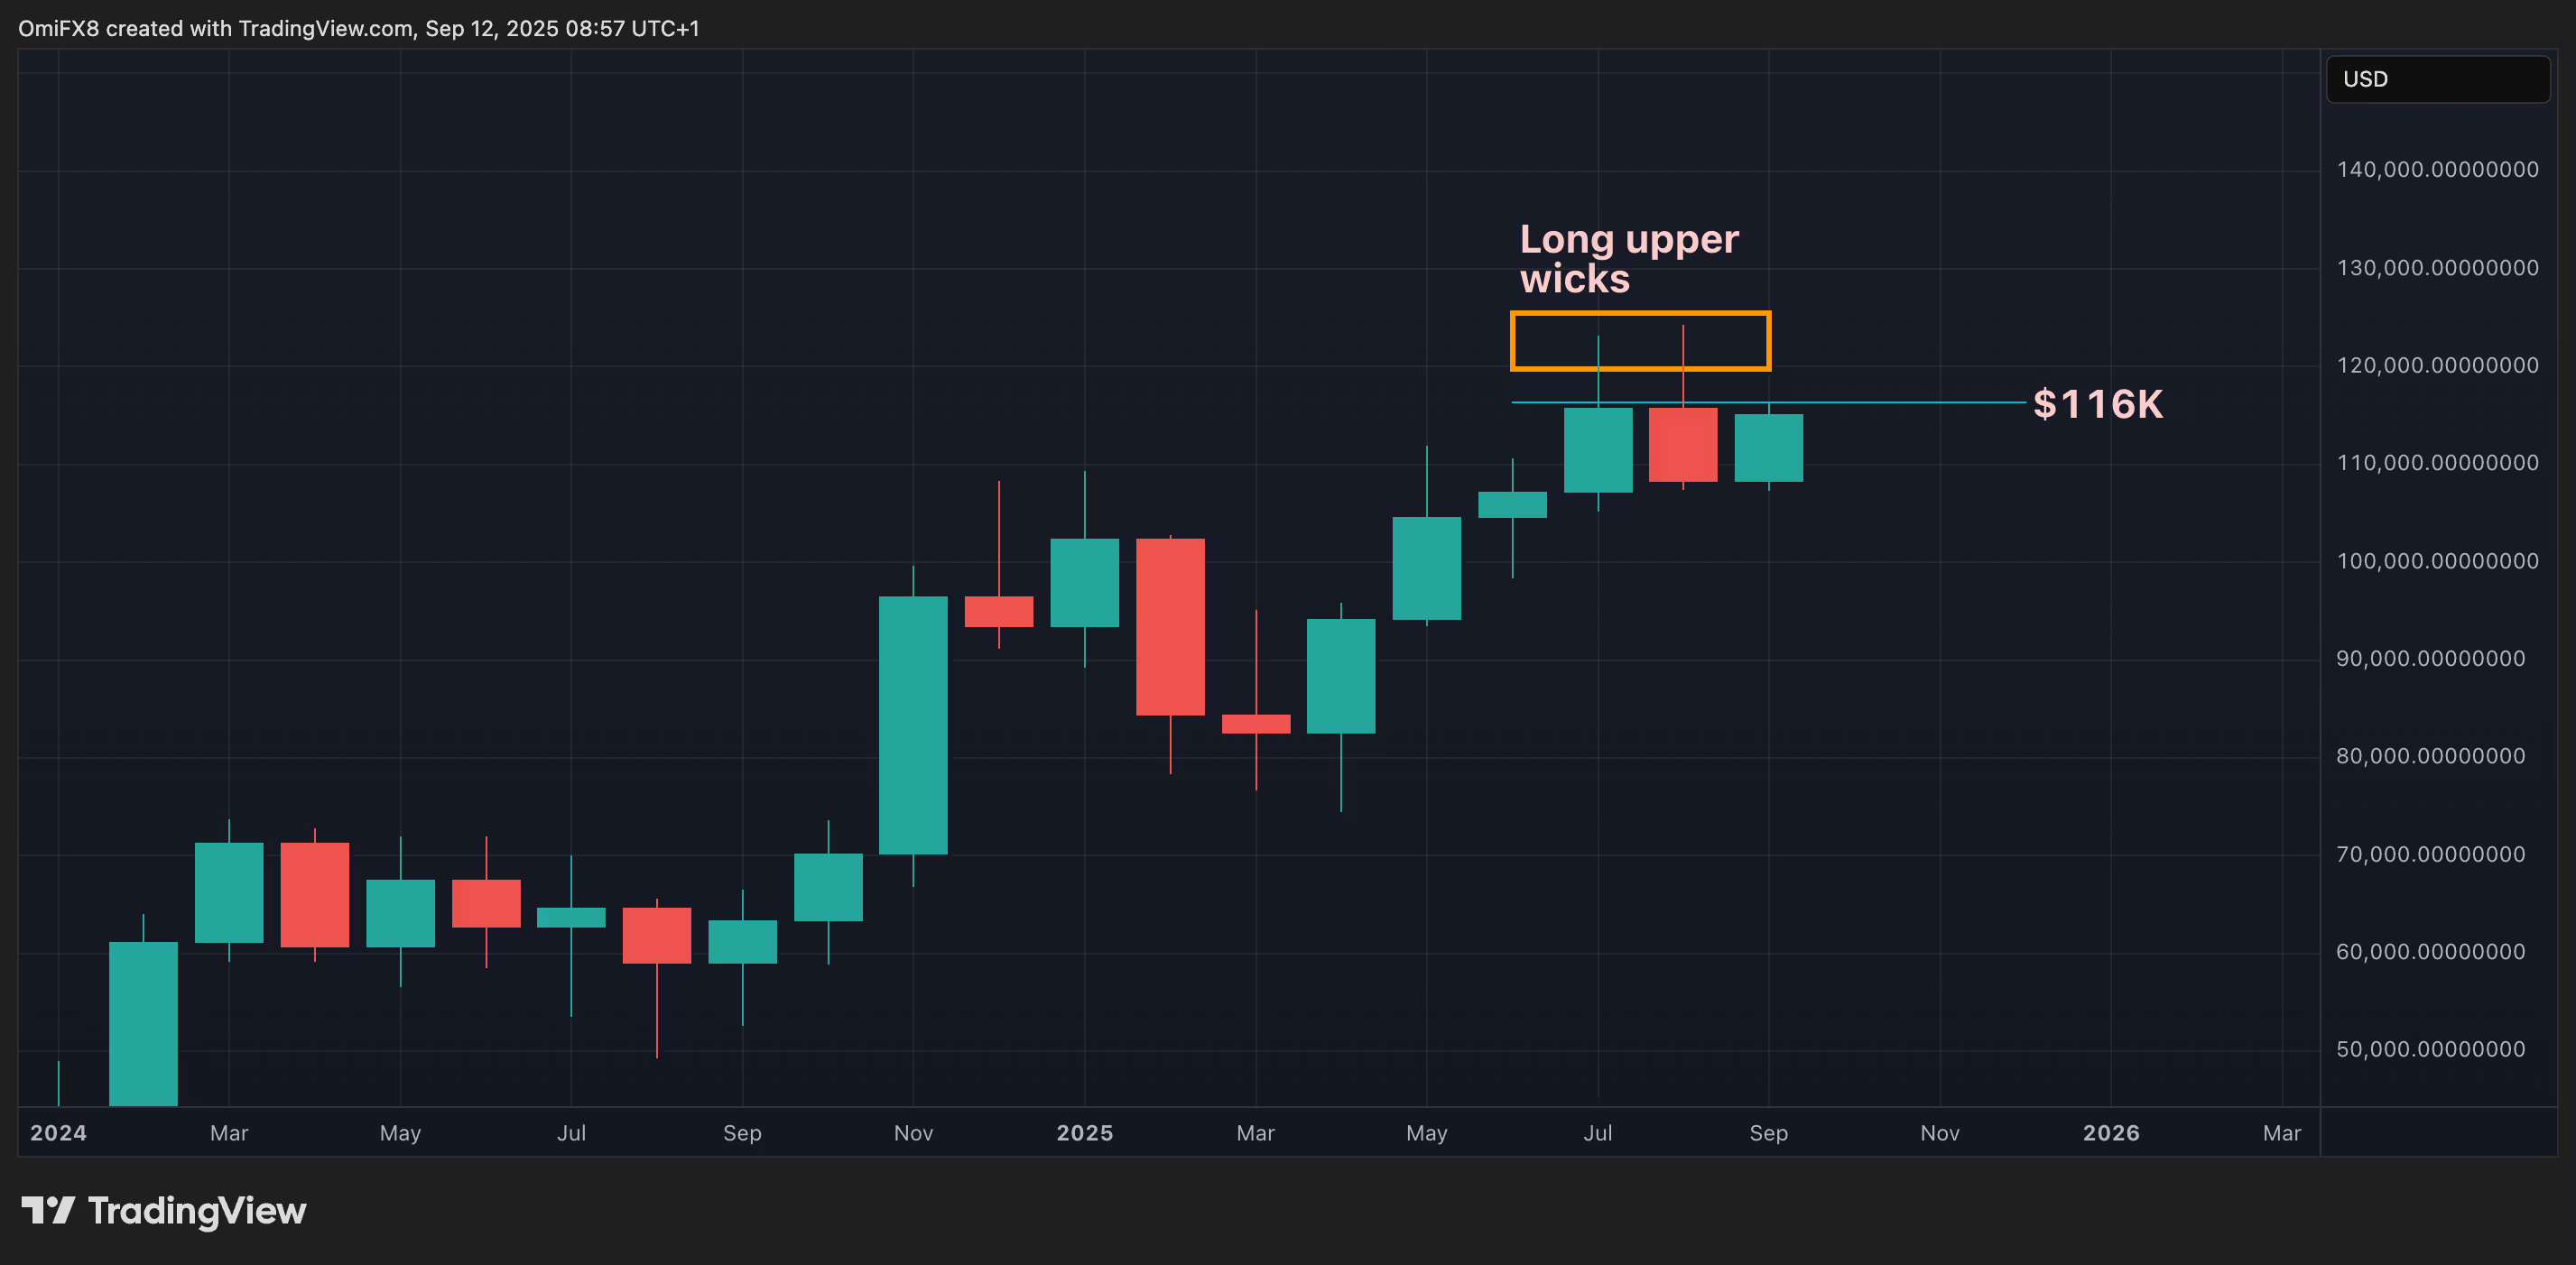
- Concerns exist about BTC nearing a "bull fatigue zone" above $115,000, as past patterns show resistance at this level.
- Traders have priced in significant Fed rate cuts by the end of 2026, suggesting a shift to lower interest rates.
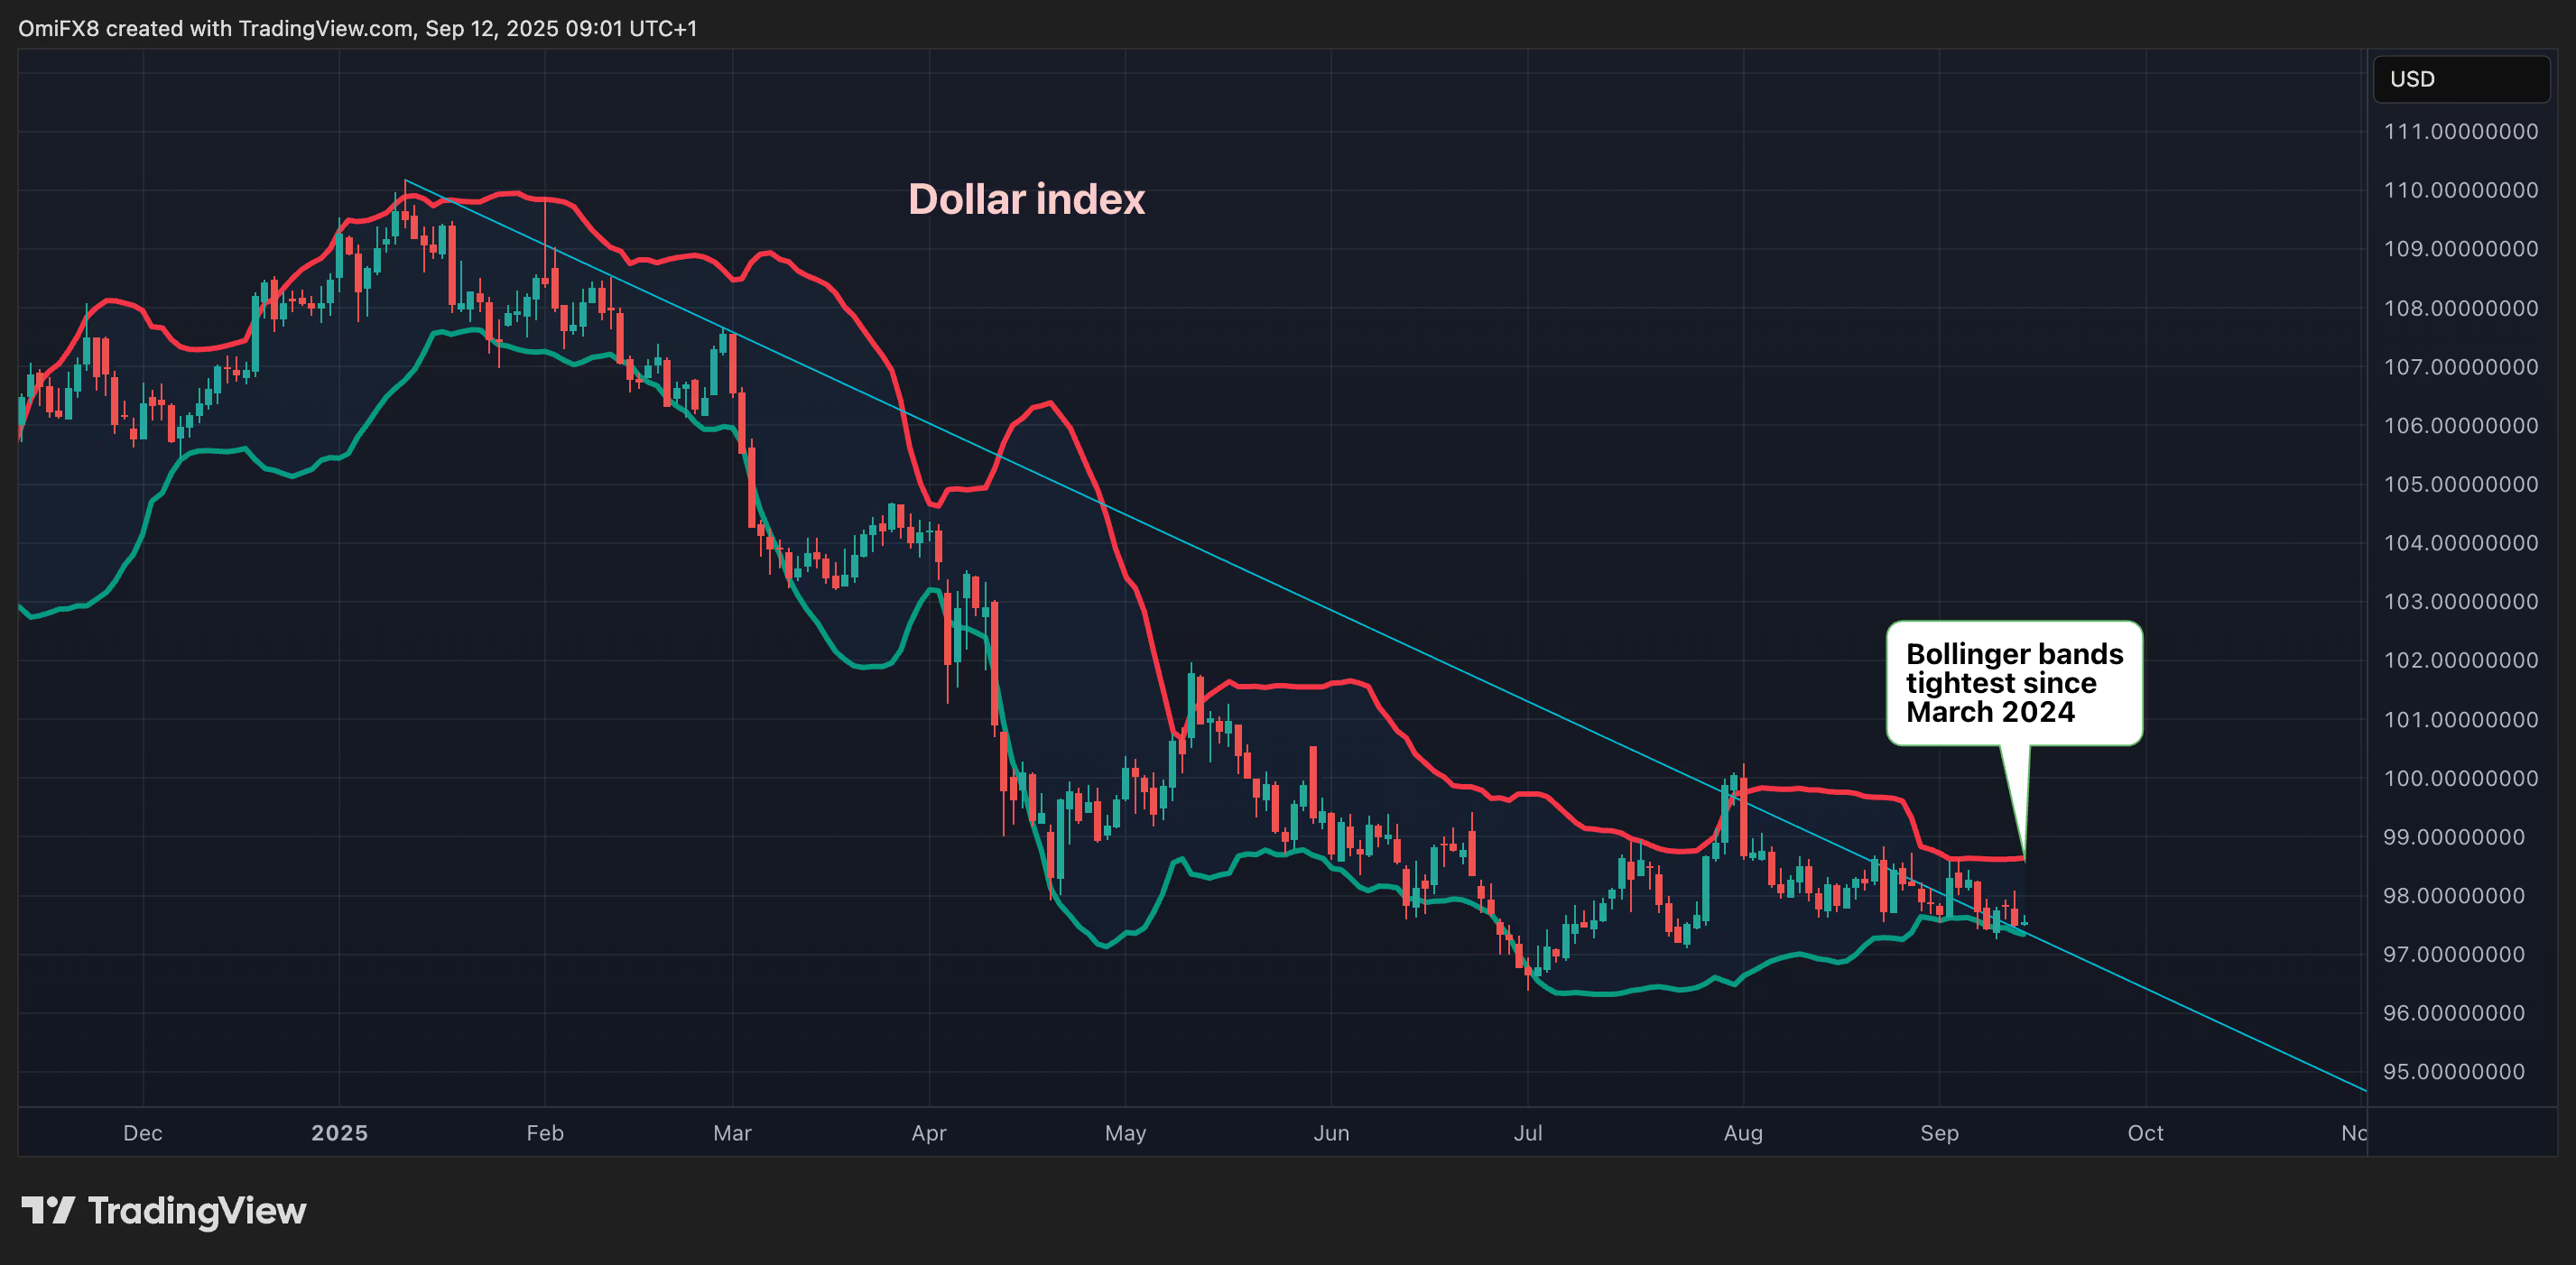
- The dollar index remains stable between 97.00 to 98.00, despite predictions of falling USD value.
- Bollinger bands indicate a potential major move in the dollar index, which could impact BTC negatively if it strengthens.
- Expectations of rapid Fed rate cuts have led to predictions of a decline in the 10-year Treasury yield.
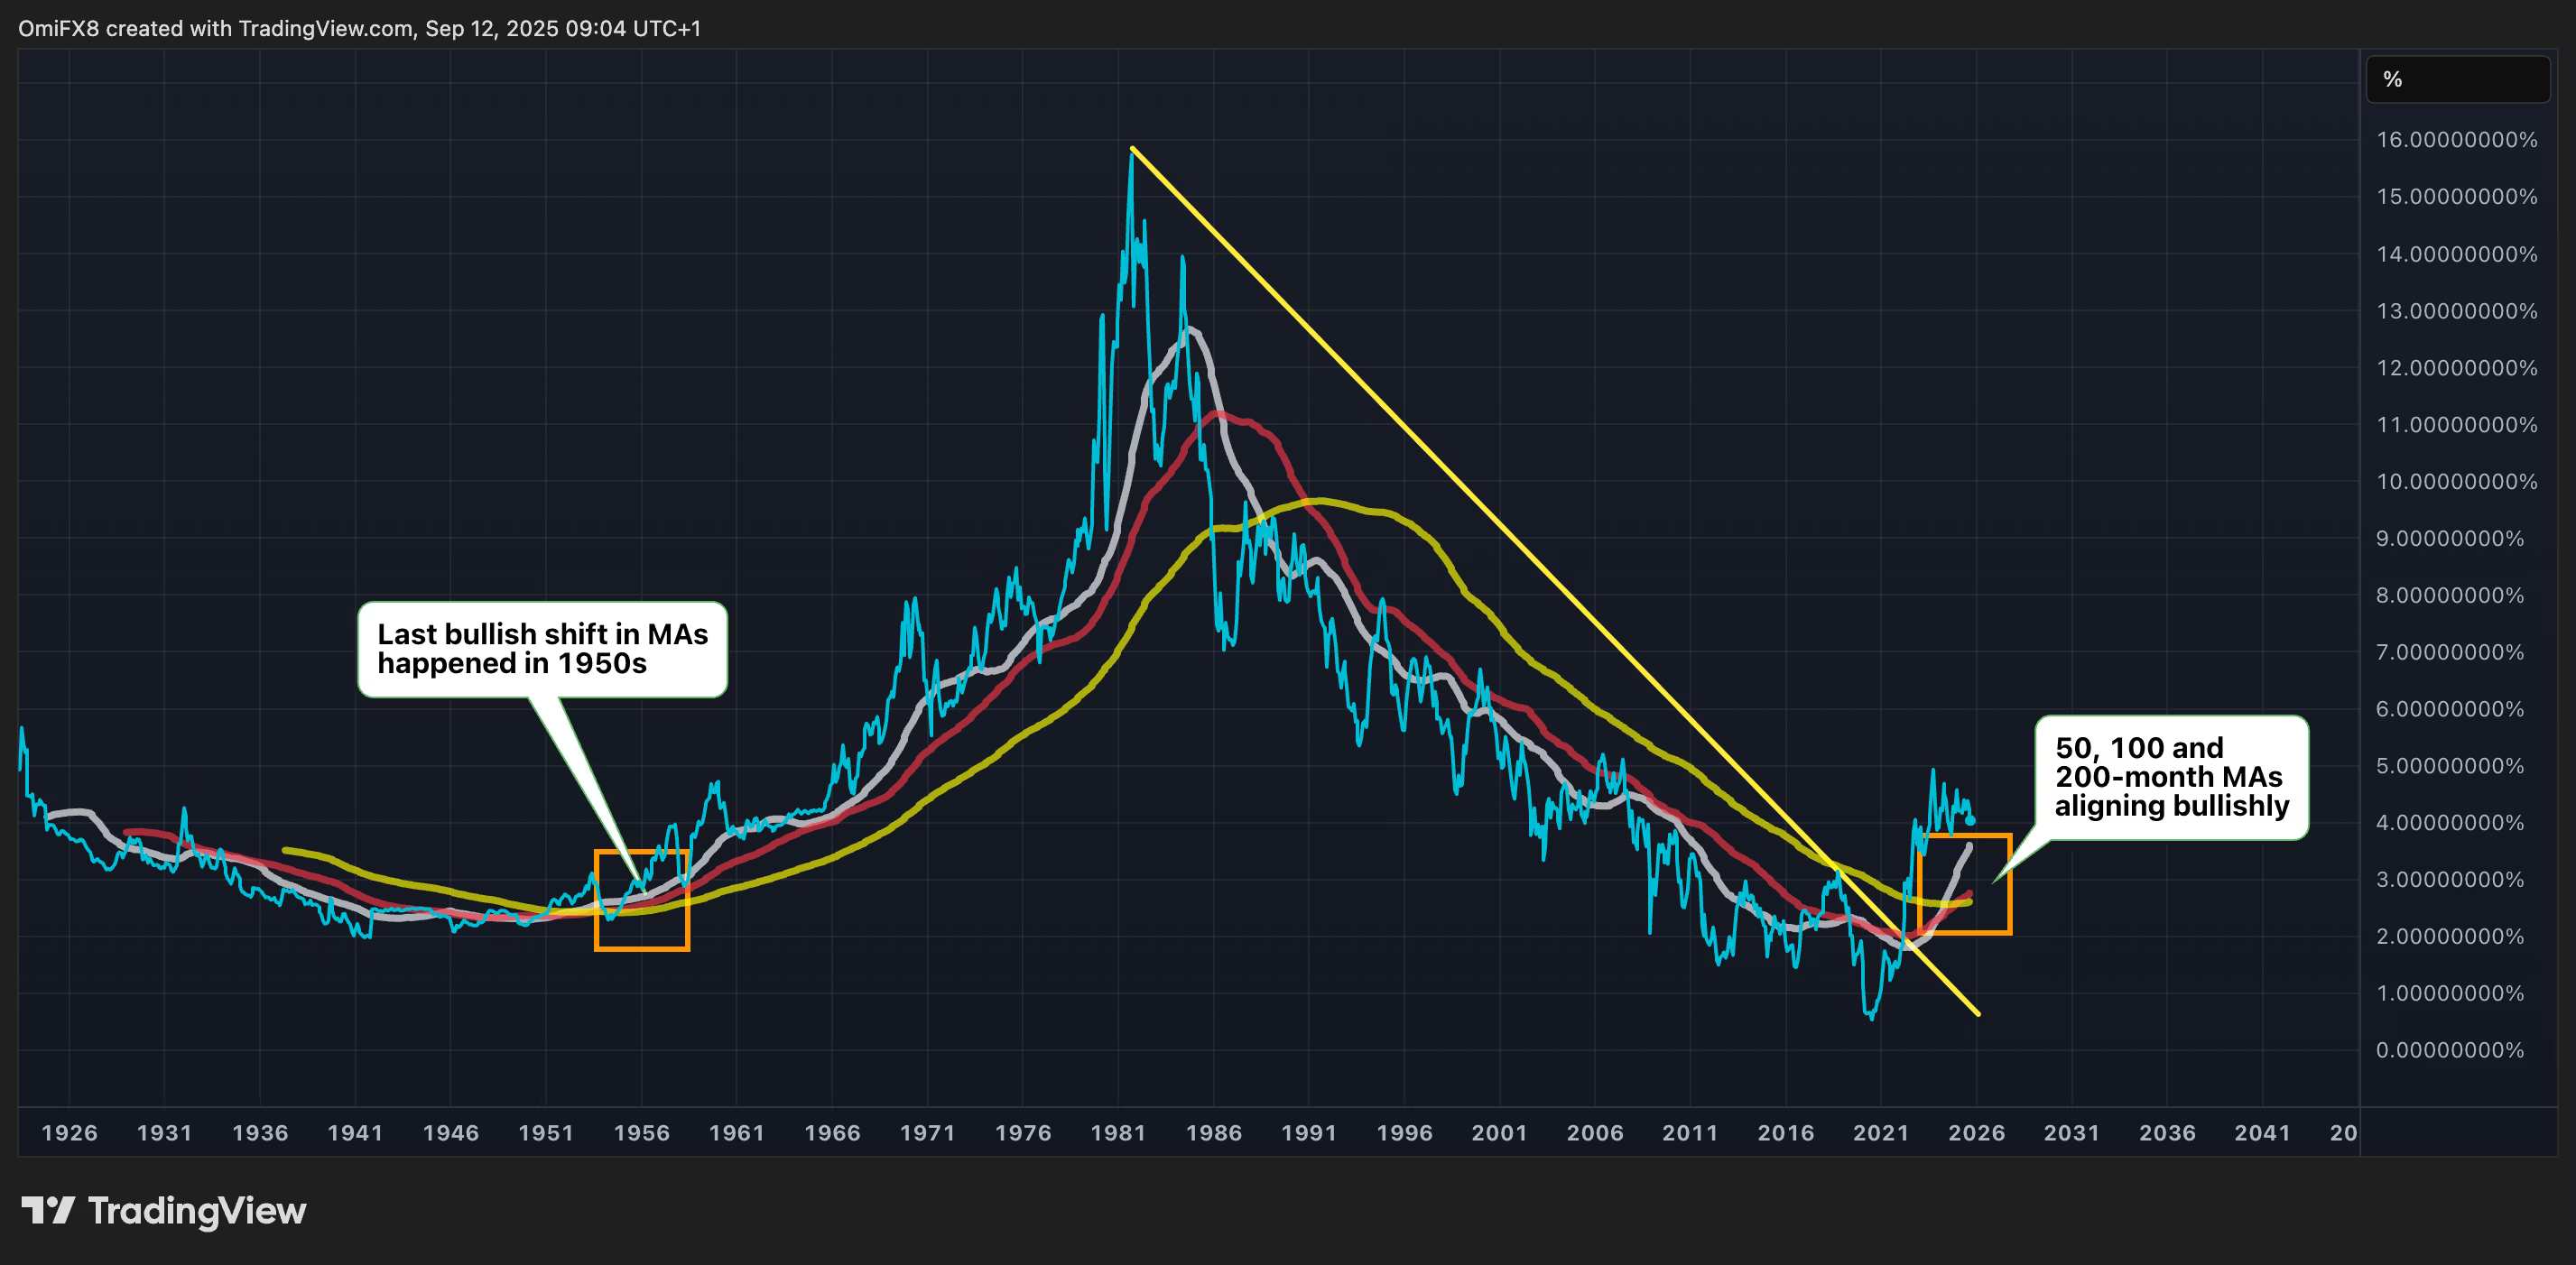
- Long-term charts show a generational bullish shift in yields, suggesting limited downside potential.
- This may prevent a significant influx into riskier assets like BTC, as fixed-income instruments remain appealing.

Dollar Index and Federal Reserve Rate Cuts

10-Year Treasury Yield Insights
