6 0
Bitcoin Faces Resistance at 2017-21 Trendline; SOL Shows Bearish Signal
Bitcoin (BTC) Analysis
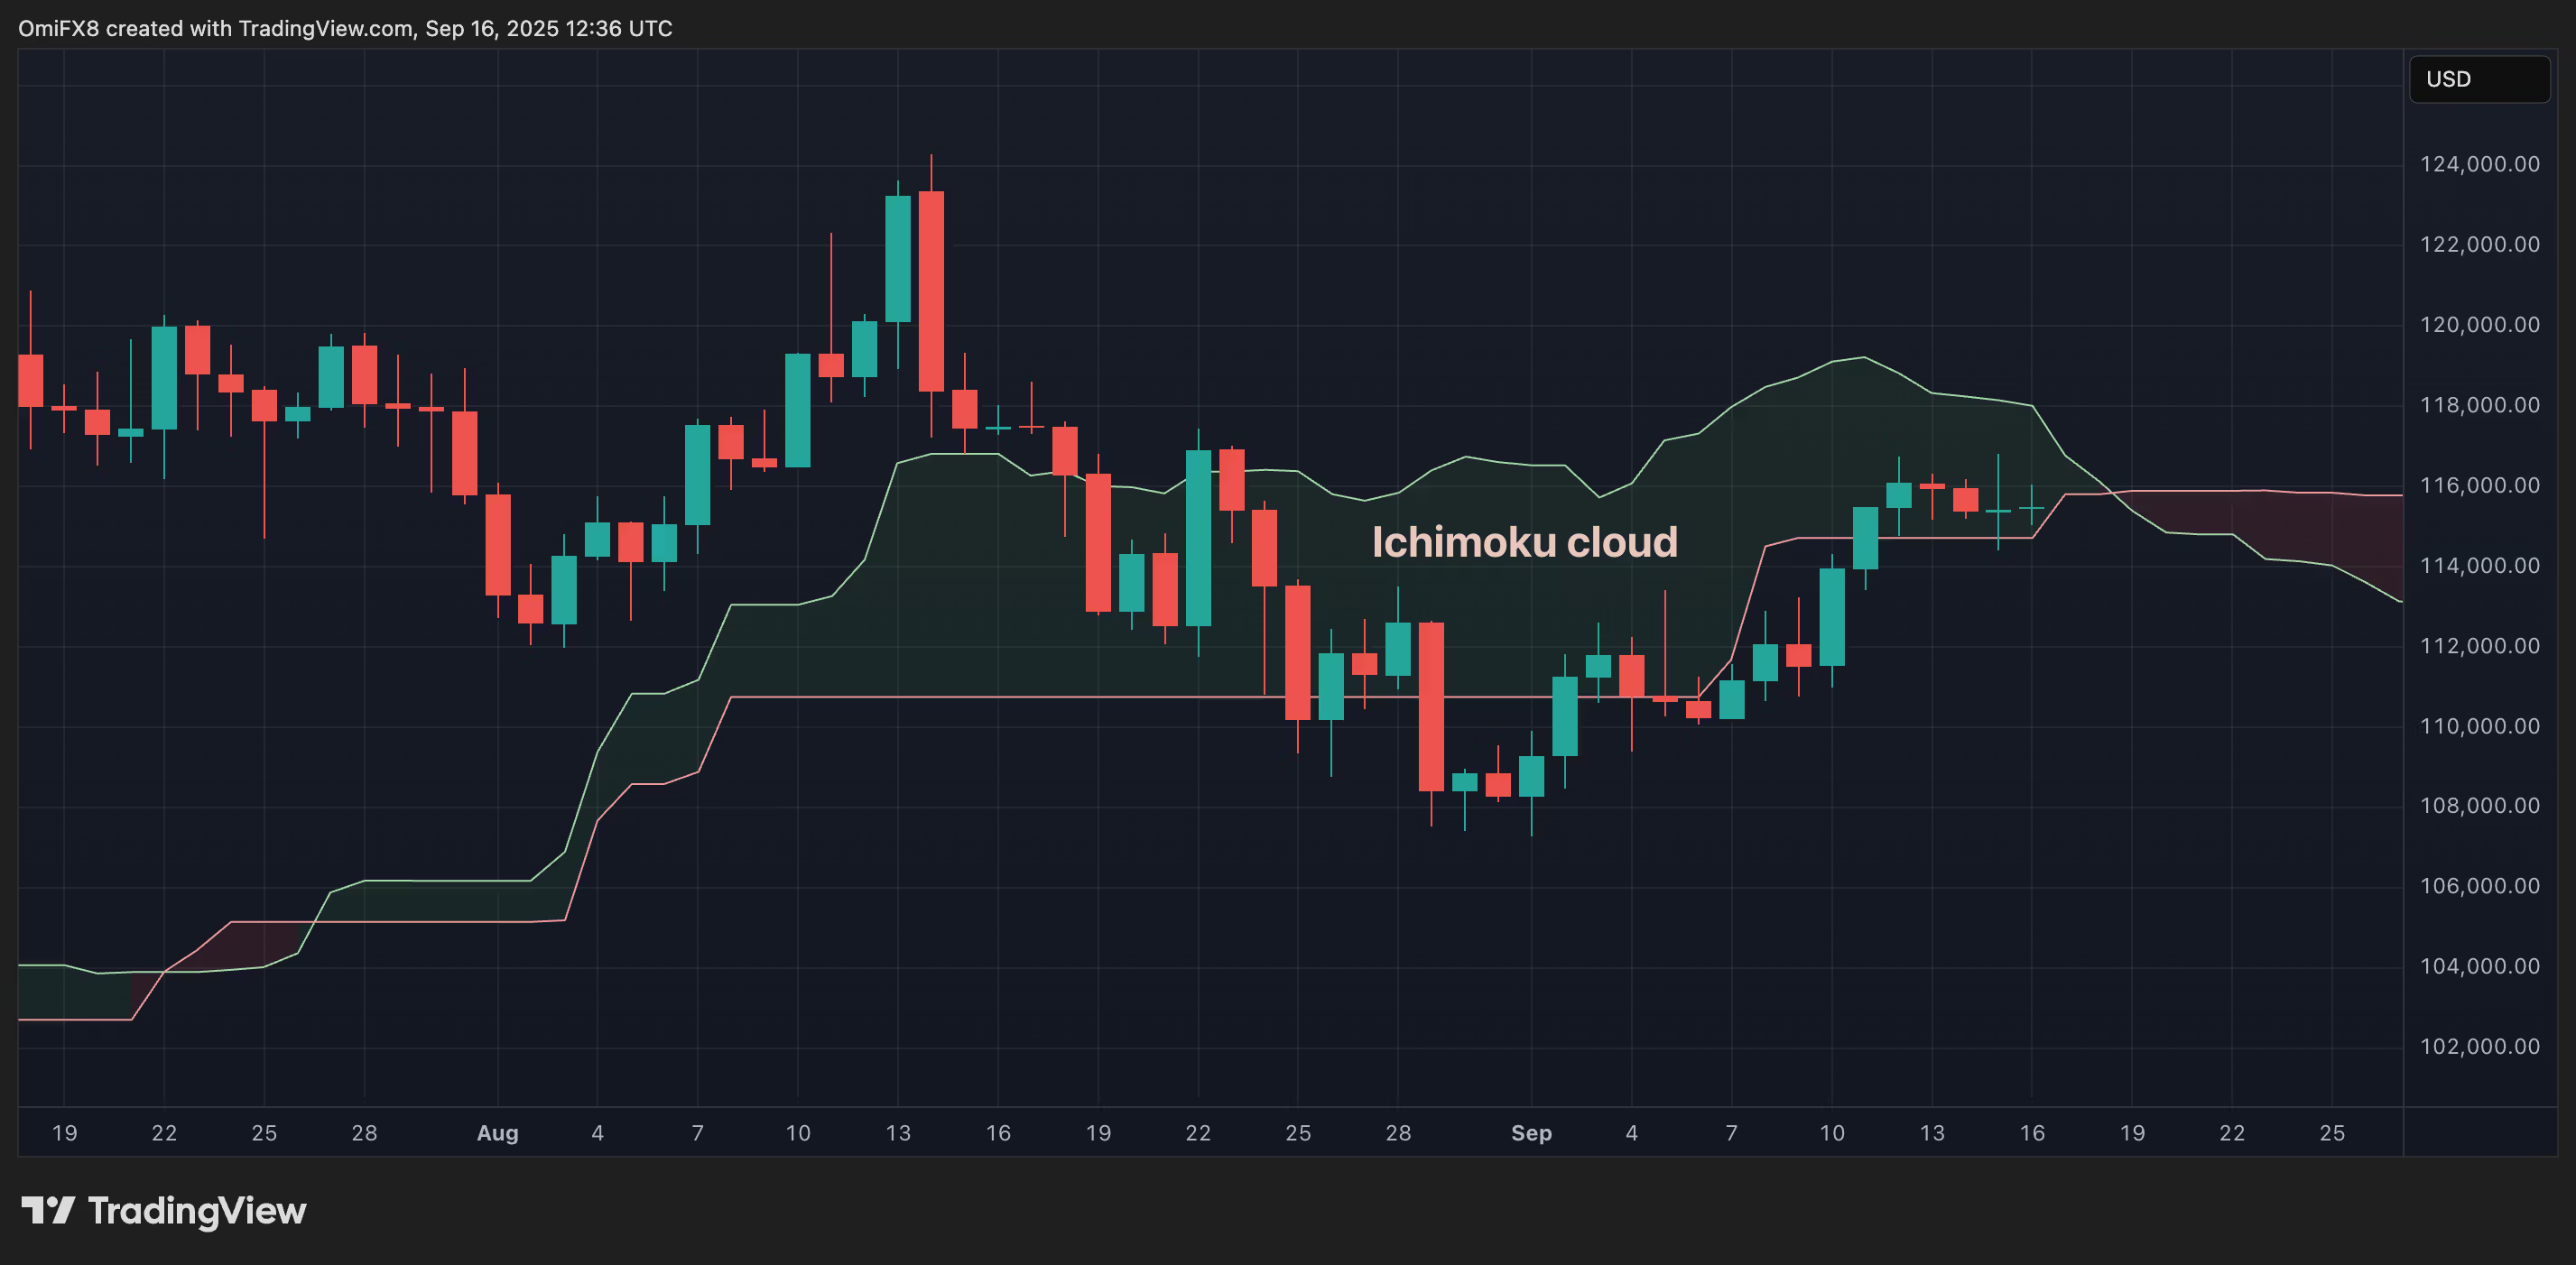
- BTC is encountering resistance at $116,000, a level of bull fatigue identified since July.
- The resistance aligns with a trendline from peaks in December 2017 and November 2021.
- If BTC fails to break this resistance on the third attempt, it could lead to a deeper pullback.
- Current prices hover around the Ichimoku cloud, indicating indecision; crossing it could signal momentum shifts.

Solana (SOL) Insights
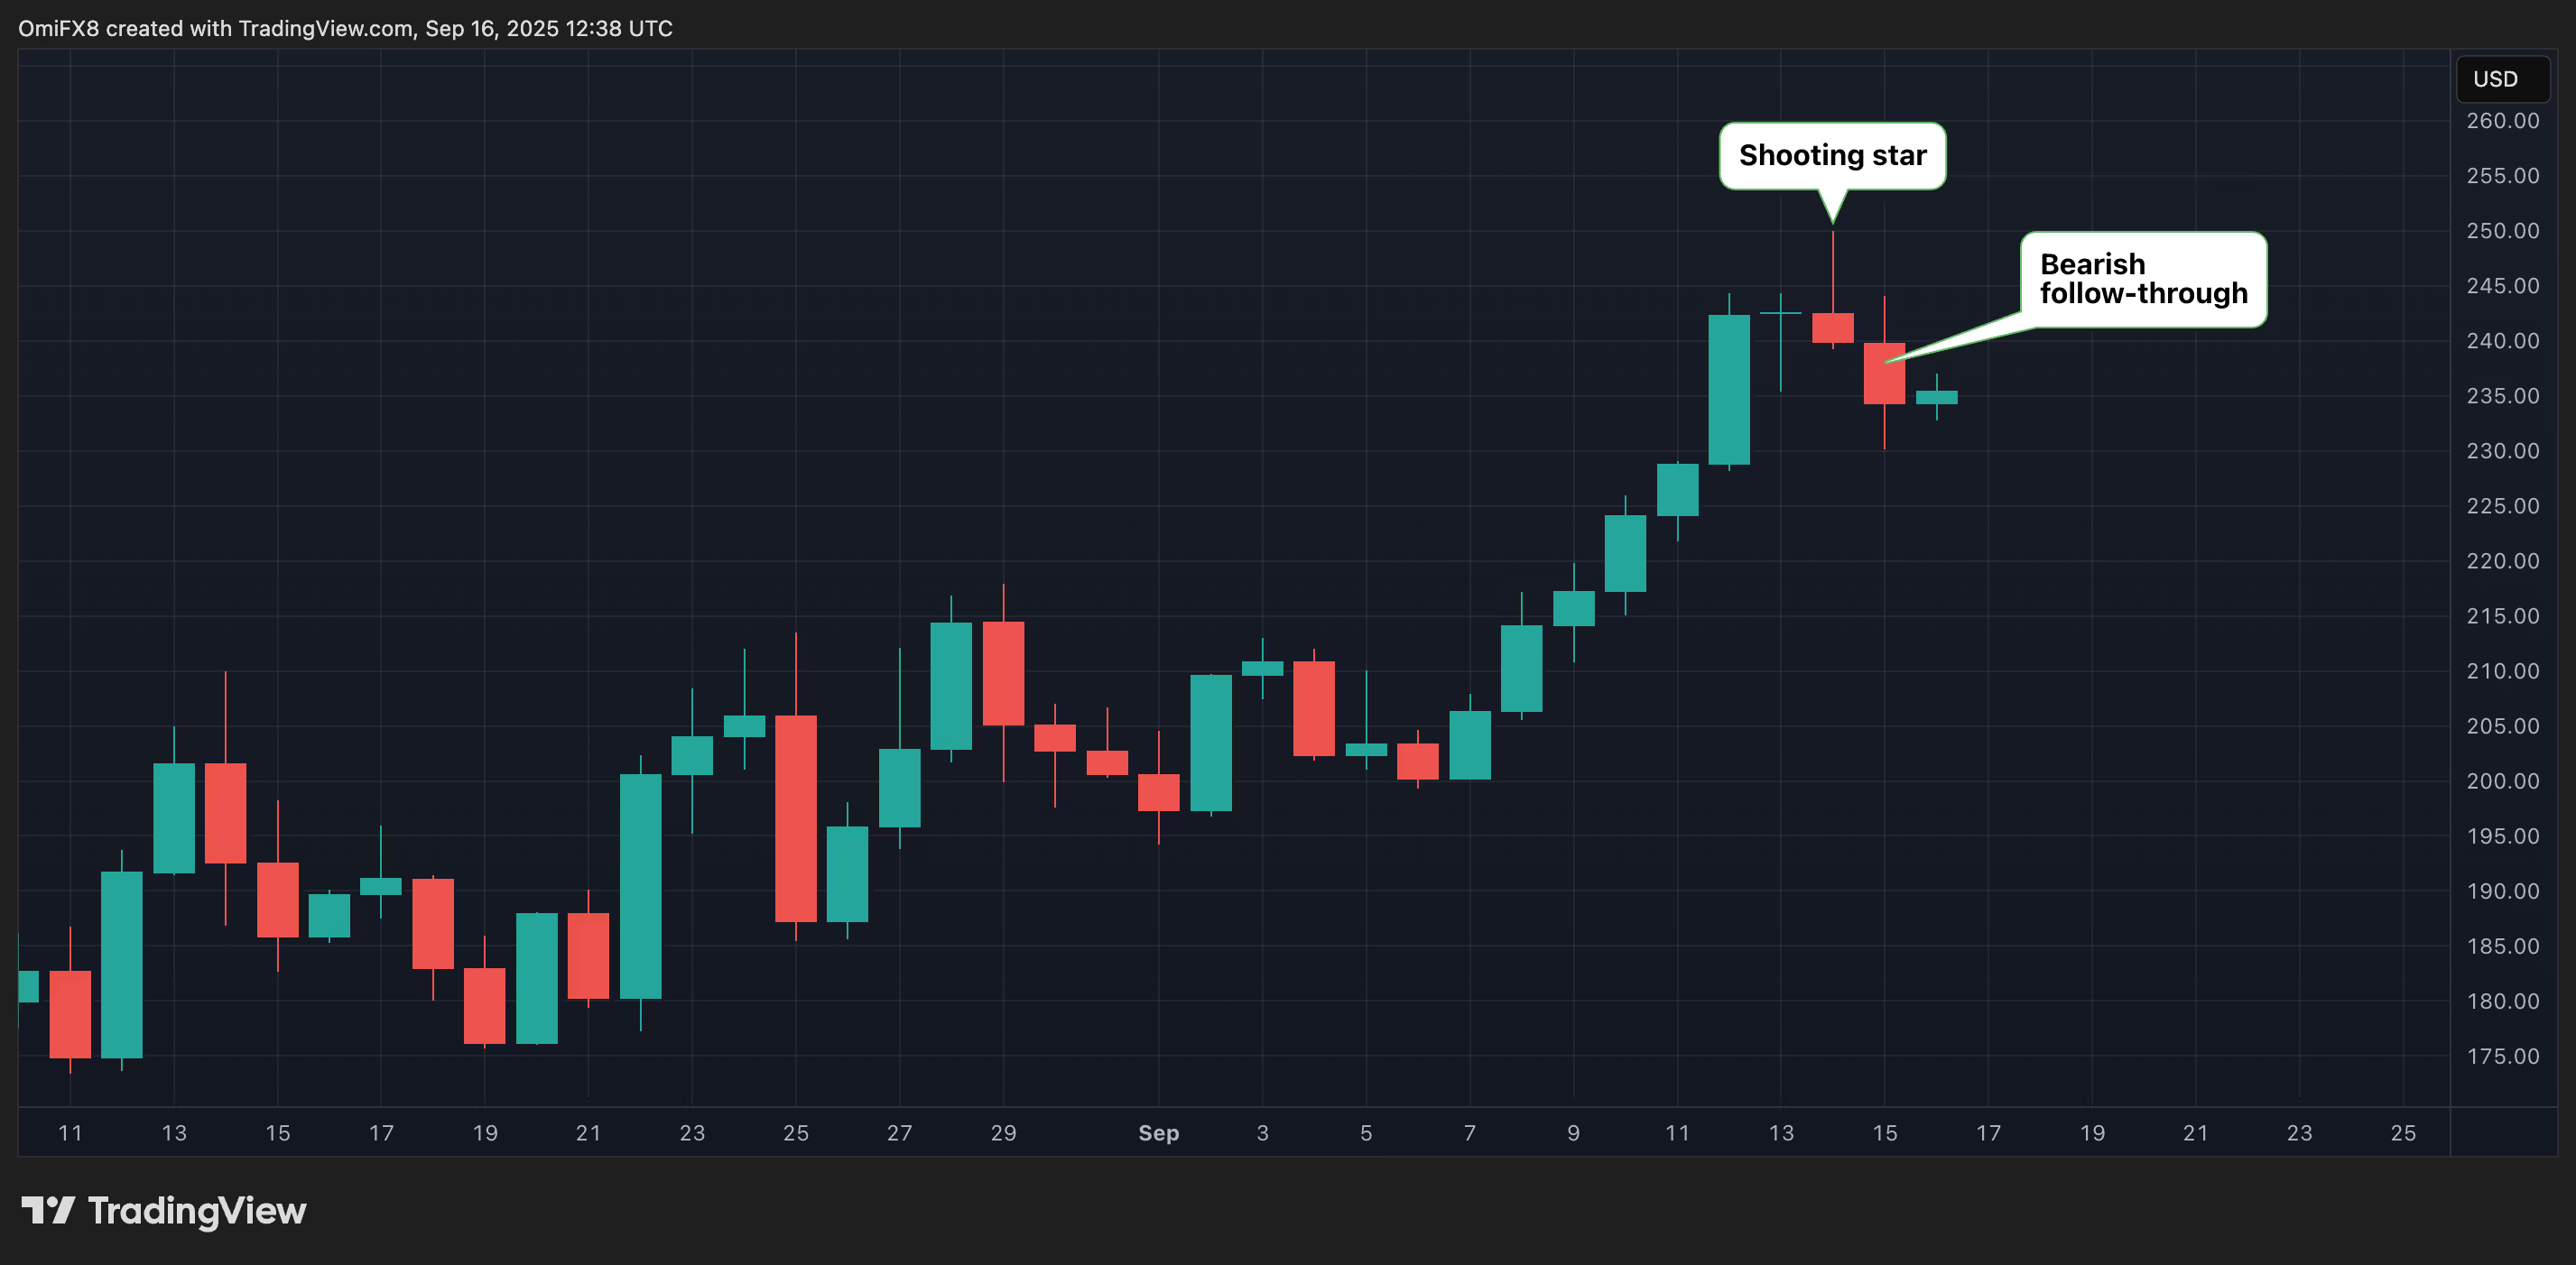
- SOL formed a "shooting star" candlestick pattern after reaching a high near $250, suggesting a bearish reversal.
- The price dipped to around $230, confirming potential trend reversal.
- Bulls need SOL to reclaim and hold above $250 to regain control.

Ethereum (ETH) Situation
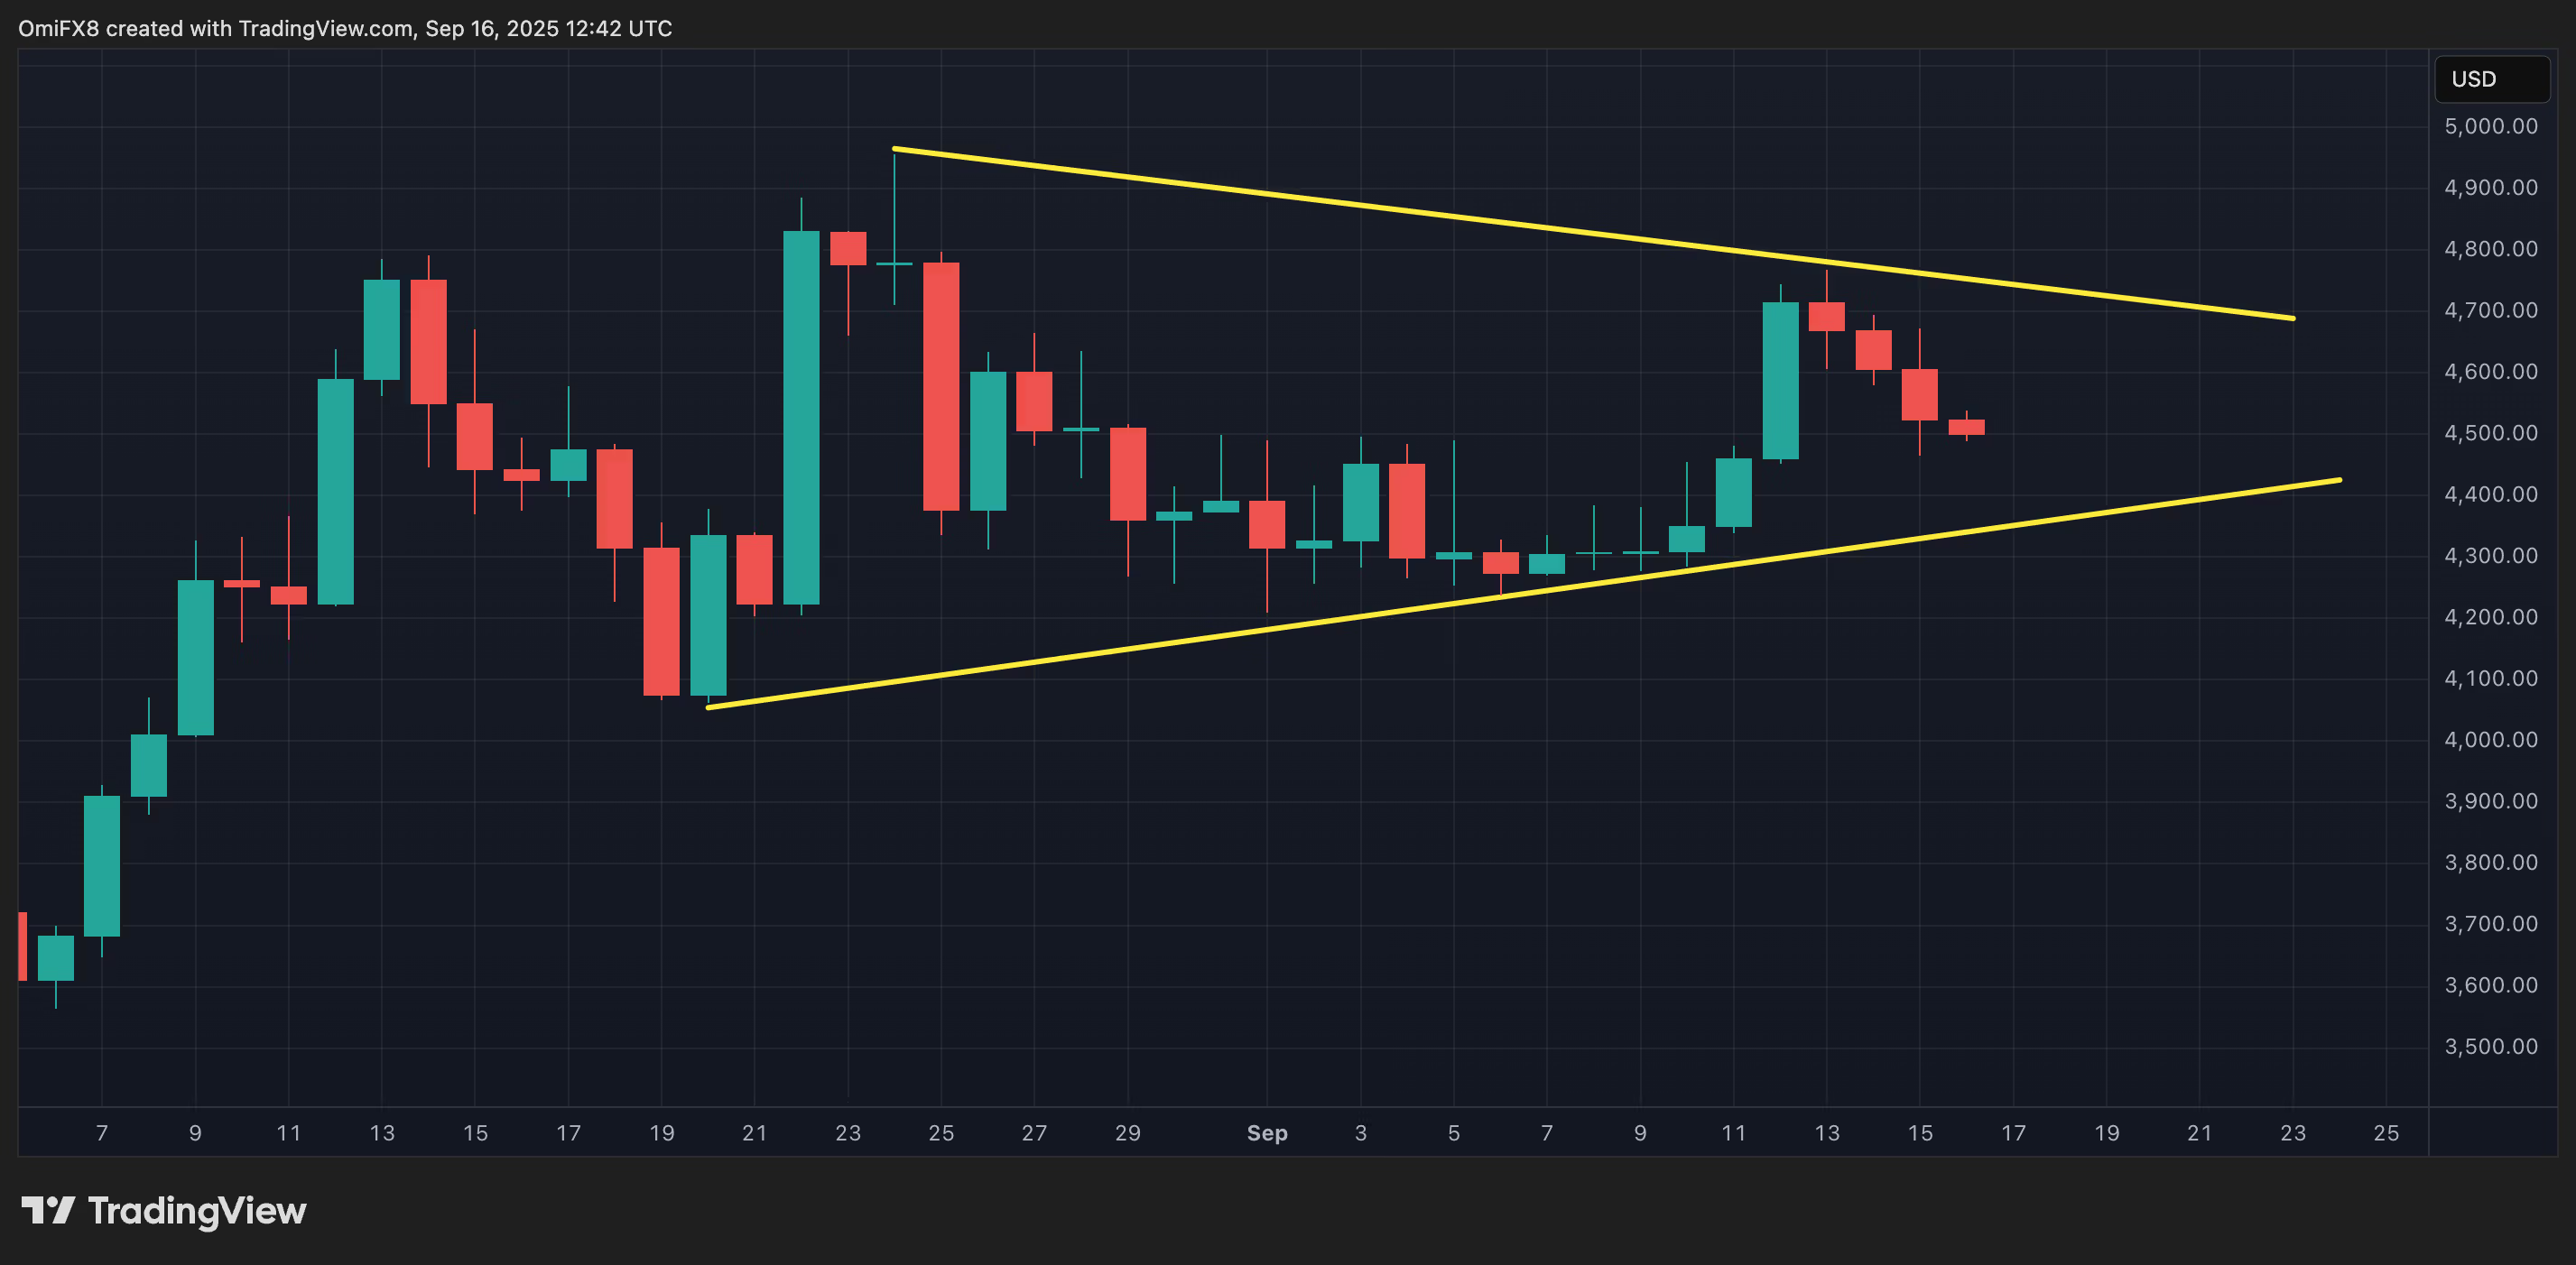
- ETH is moving sideways after reaching an all-time high near $5,000.
- A symmetrical triangle pattern has formed, indicating market indecision.
- Expect a breakout or breakdown to determine the next price direction.

Investors should monitor these technical patterns closely to anticipate potential market movements.