Sep 16, 2025
6 0
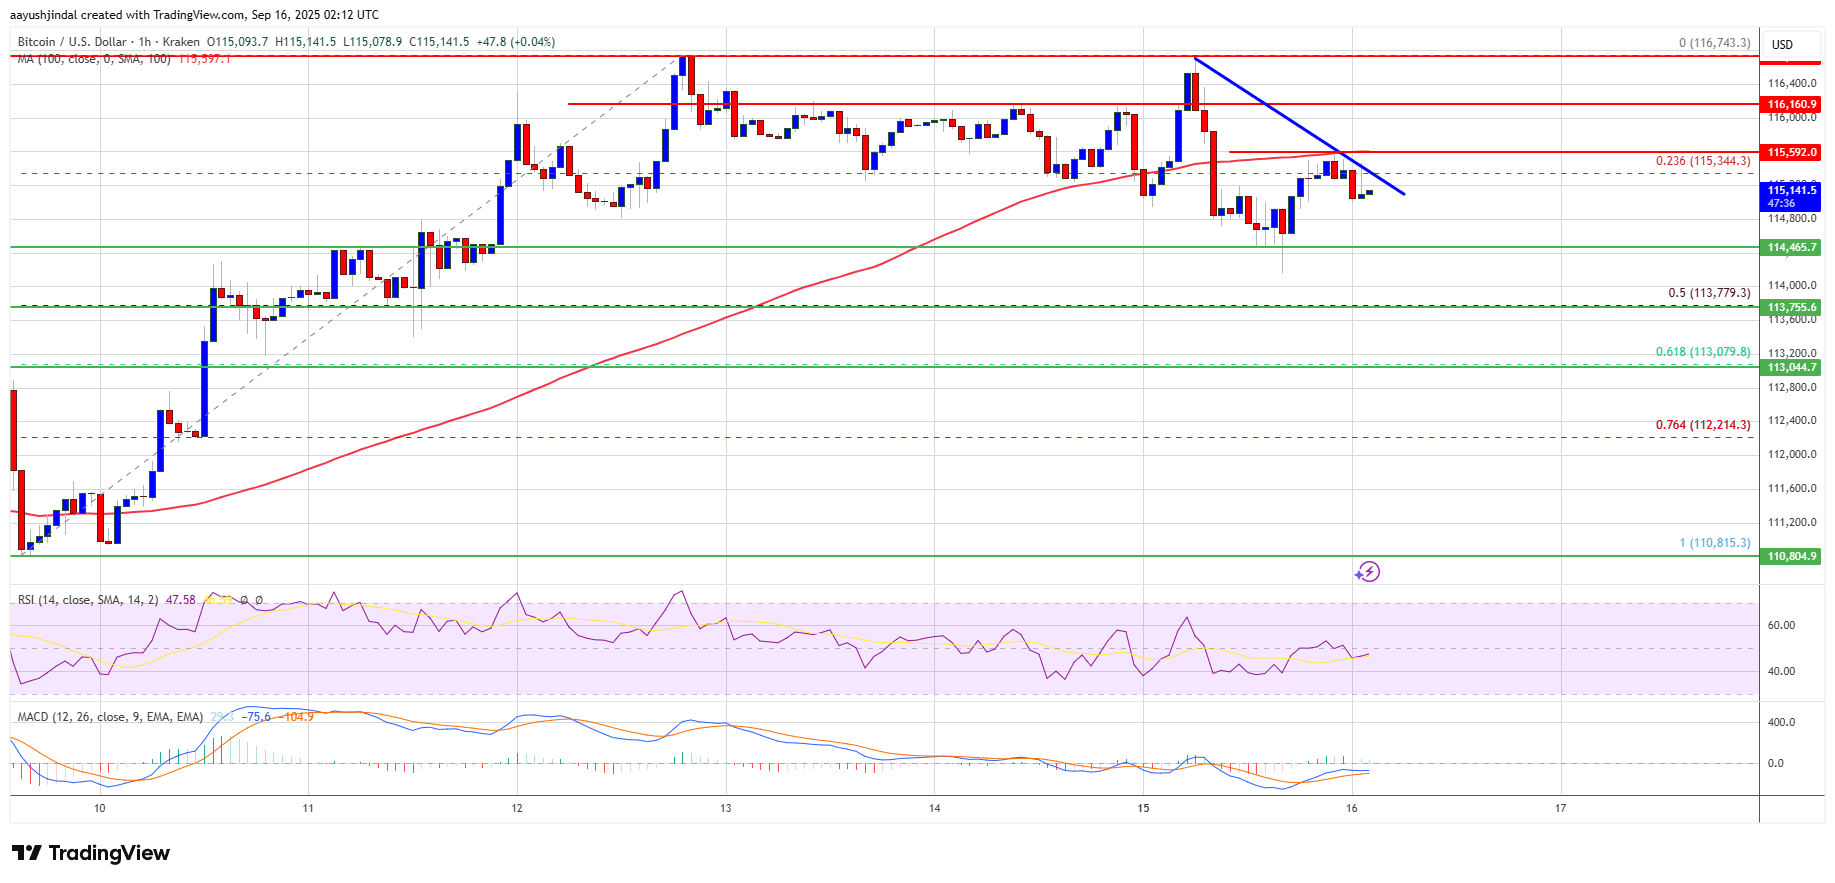
Bitcoin Faces Resistance, Potential Decline Below $113K
Bitcoin Price Analysis
- Bitcoin experienced an increase, surpassing the $115,000 mark.
- The price remains below $115,500 and the 100-hour simple moving average.
- A bearish trend line is forming with resistance at $115,350 on the BTC/USD hourly chart.
- For an upward move, Bitcoin needs to clear the $116,500 resistance zone.
Current Situation
- Bitcoin reached a high of $116,743 before starting a correction.
- The price dropped below the 23.6% Fib retracement level from the recent upswing.
- Immediate resistance levels are at $115,350 and $116,150.
- If Bitcoin breaks above $116,750, it could test $117,500 or even $118,800.
Potential Downside
- If Bitcoin fails to surpass $116,150, a decline may ensue.
- Support levels are at $114,500 and $113,750.
- Further declines could push the price to $112,500 or $110,500.
Technical Indicators
- Hourly MACD: Losing momentum in the bullish zone.
- Hourly RSI: Below the 50 level.