Feb 12, 2026
6 0
BULLISH 📈 : Crypto Analyst Identifies Maximum Opportunity Zone for Dogecoin
Dogecoin Analysis by Cryptollica
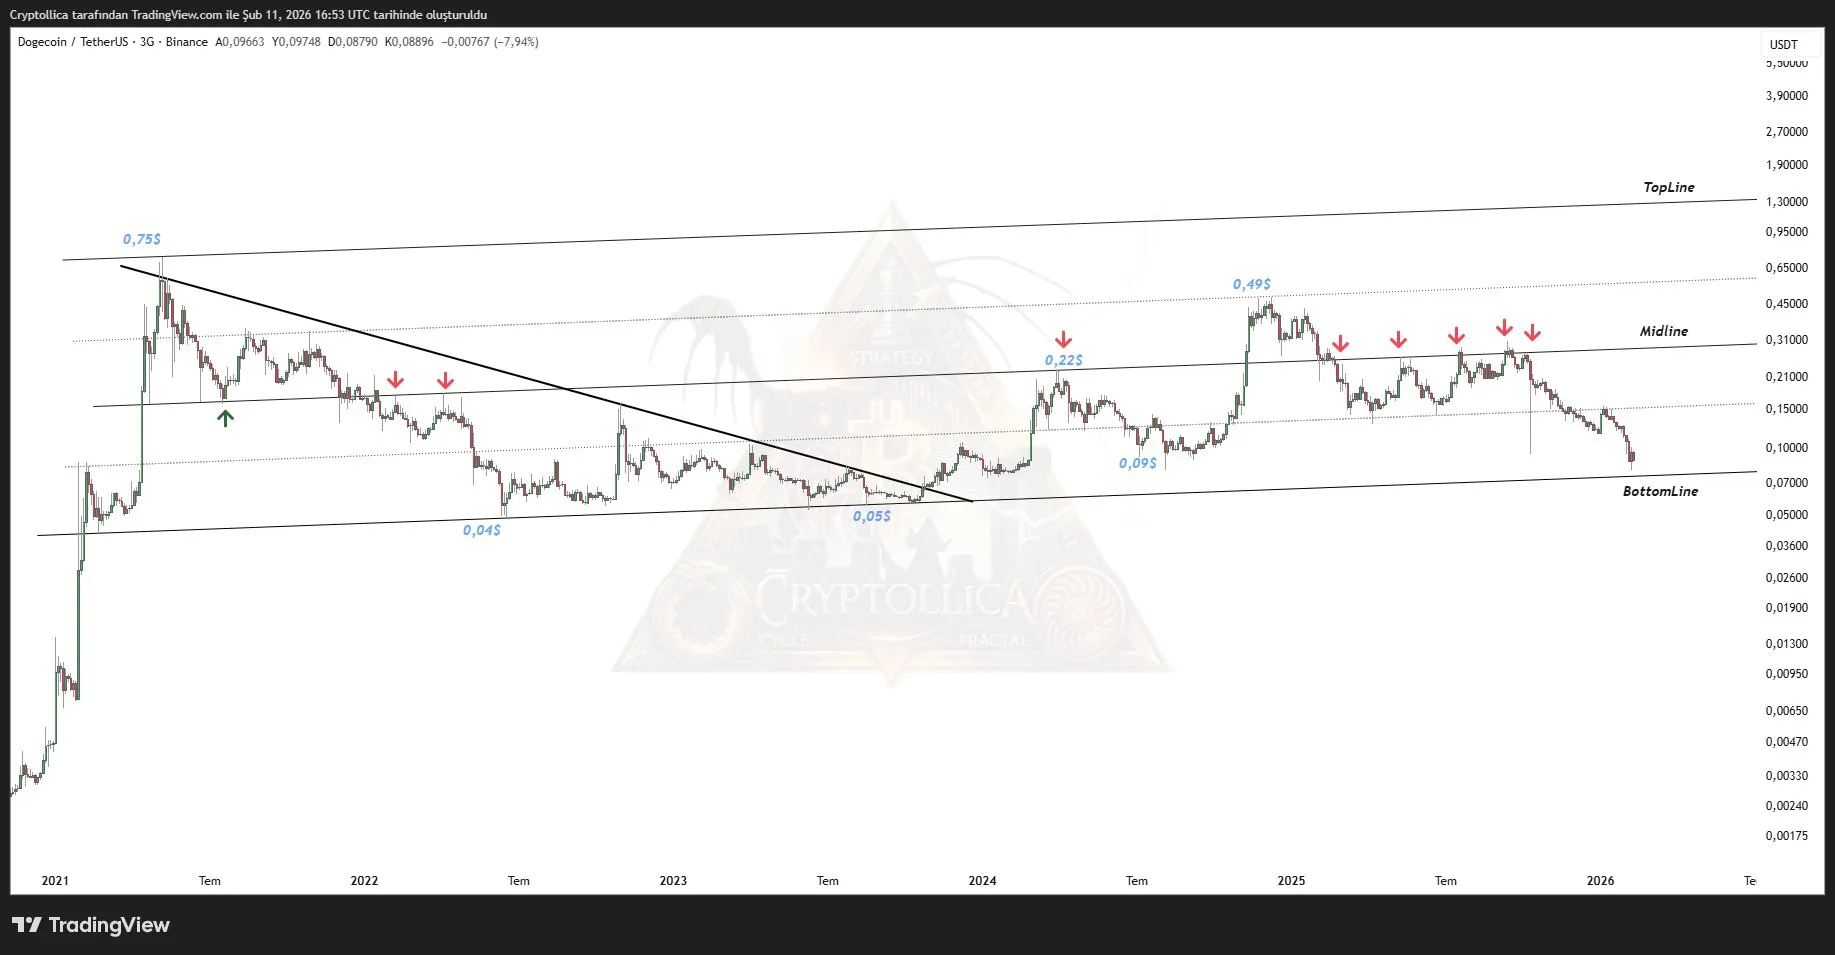
- Cryptollica identifies a "maximum opportunity/minimum risk" setup for Dogecoin based on long-horizon indicators.
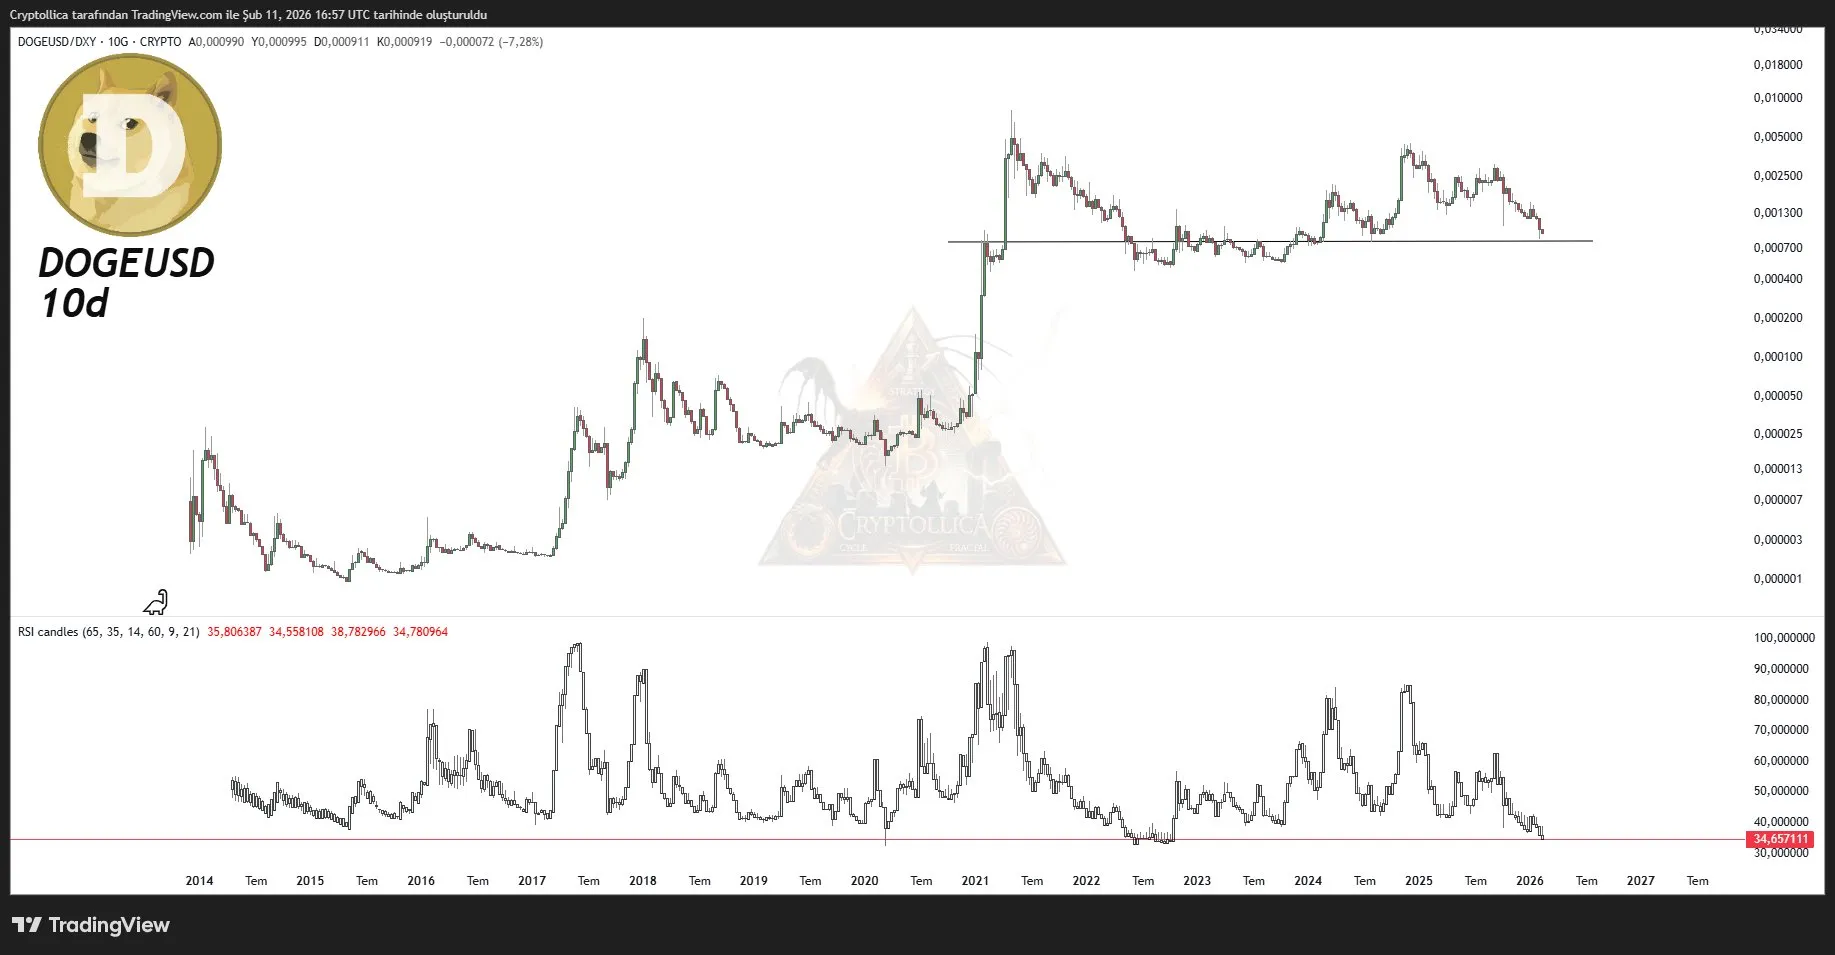
- A 10-day DOGE chart against the US Dollar Index (DXY) indicates a reset to a historically significant base level, referred to as the "Launchpad."
- The "Launchpad," previously a resistance level in 2021, is now acting as macro support in 2022, 2023, and 2026.
- The 10-day RSI is at 34, a zone that previously marked cyclical bottoms and significant rallies in 2015, March 2020, and 2022.
Potential for Dogecoin Bottom
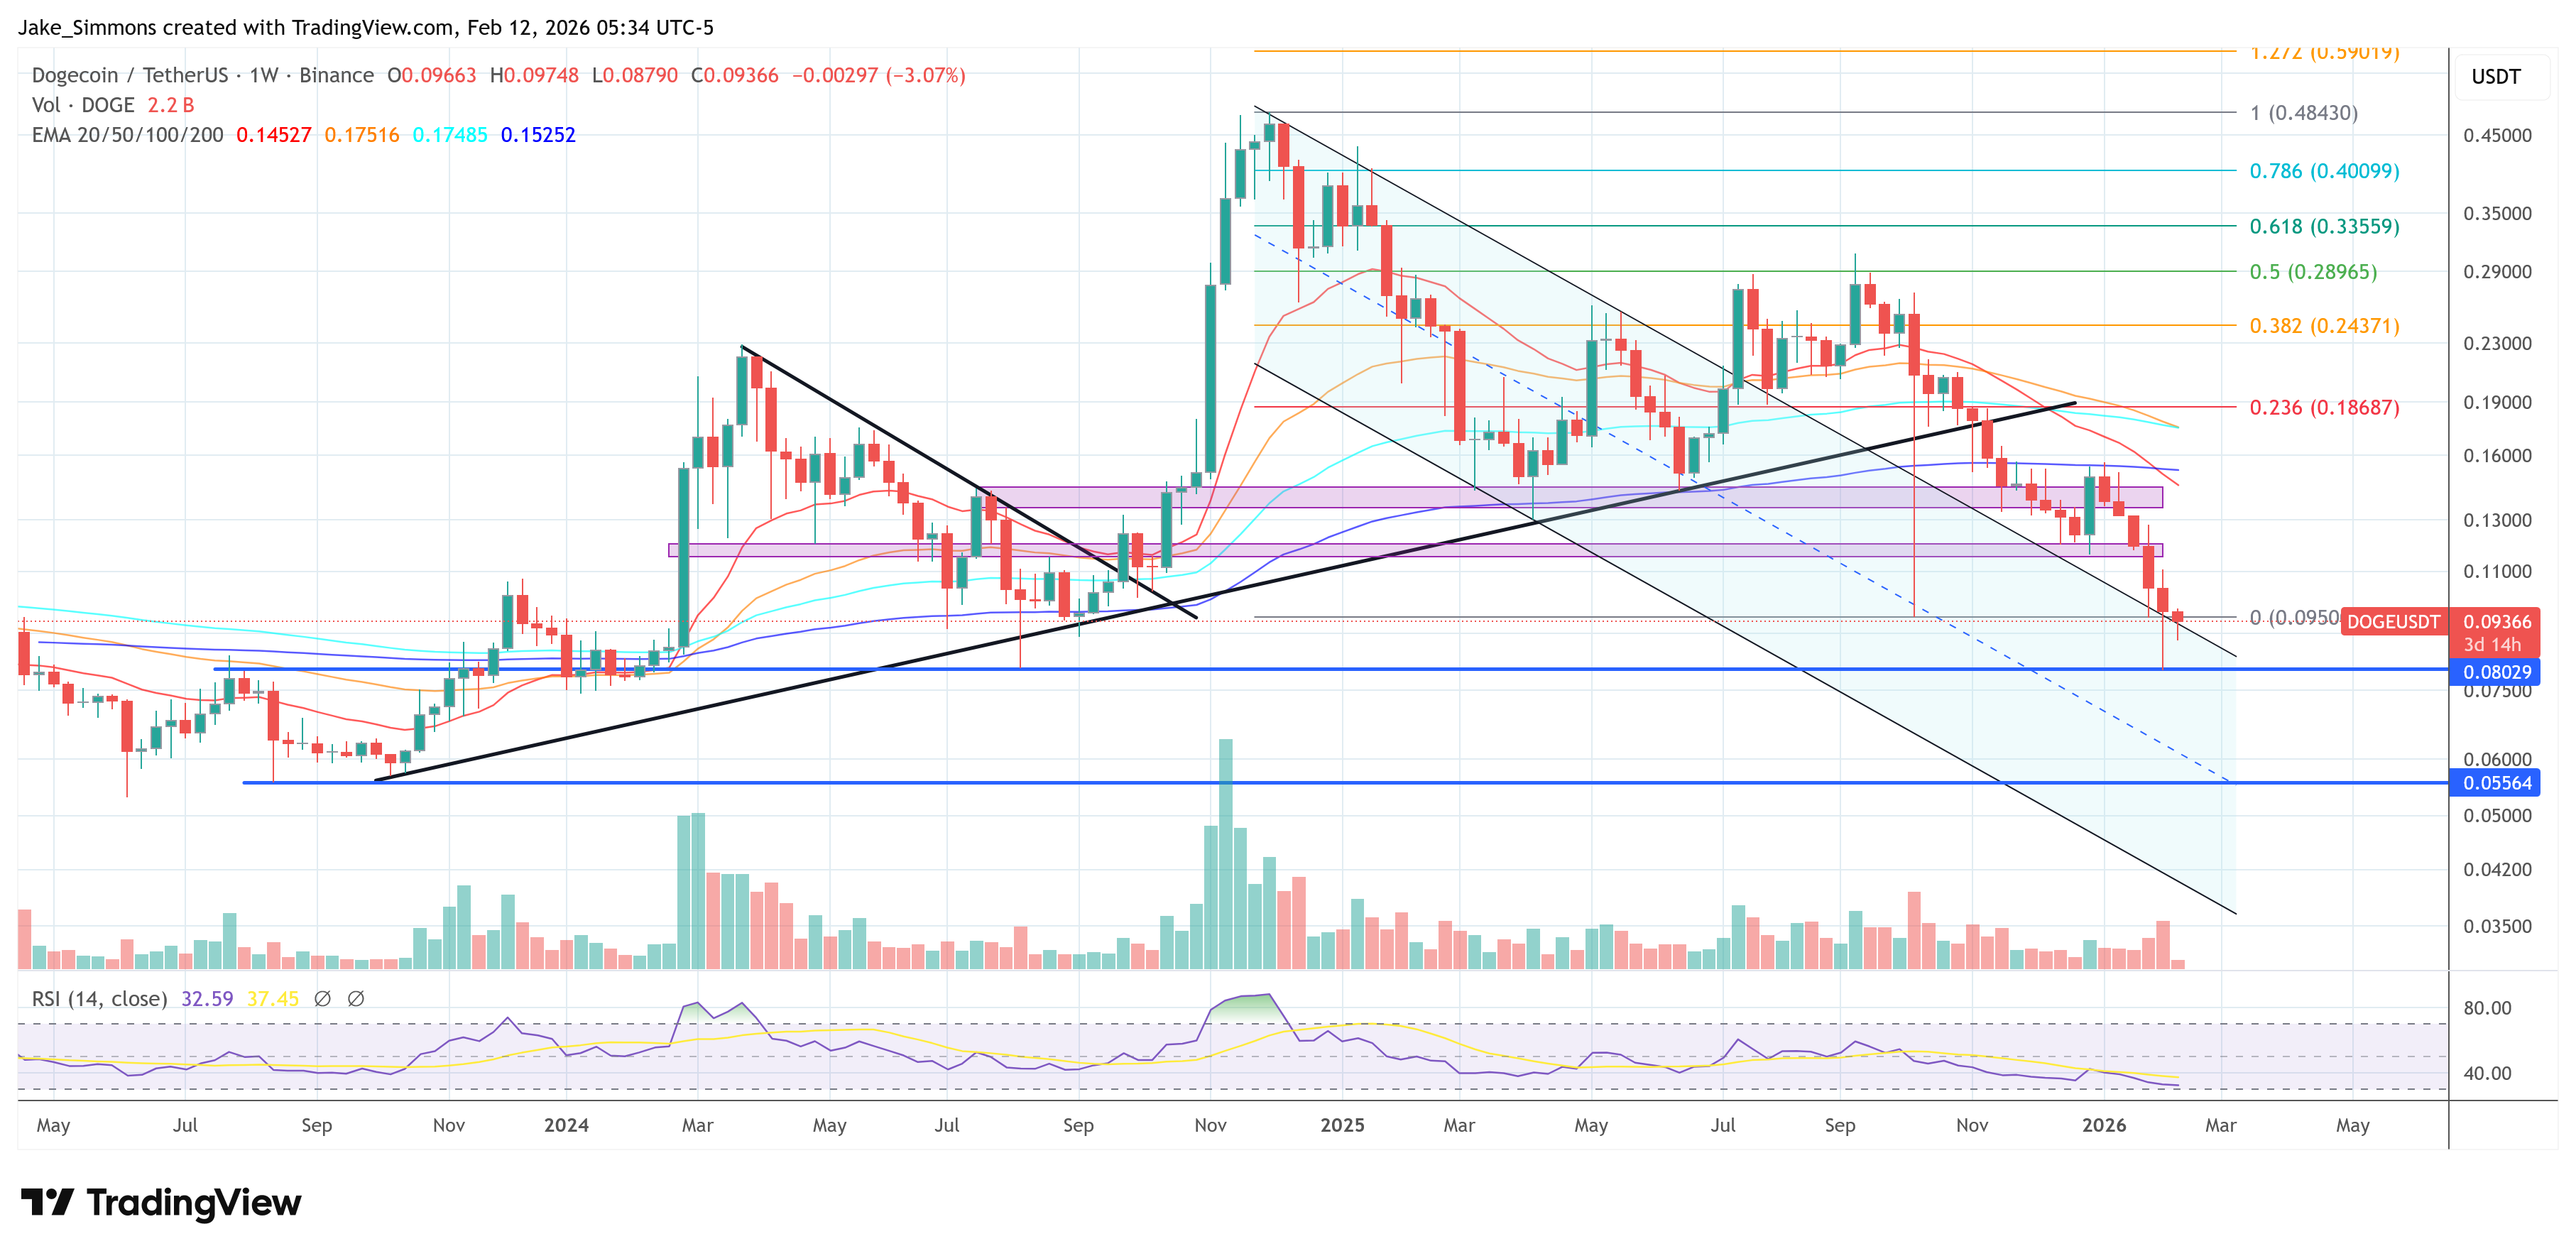
- Another DOGE/USDT chart suggests a potential bottom, with prices drifting toward $0.07–$0.08.
- This analysis highlights the importance of the "launchpad" support holding for any potential price rebound.
At the time of analysis, Dogecoin traded at $0.09366.