Apr 16, 2025
5 0
Cardano (ADA) Chart Indicates Potential for Major Upside Move
Cardano (ADA) shows early signs of a potential breakout, according to analyst Thomas Anderson. Key points include:
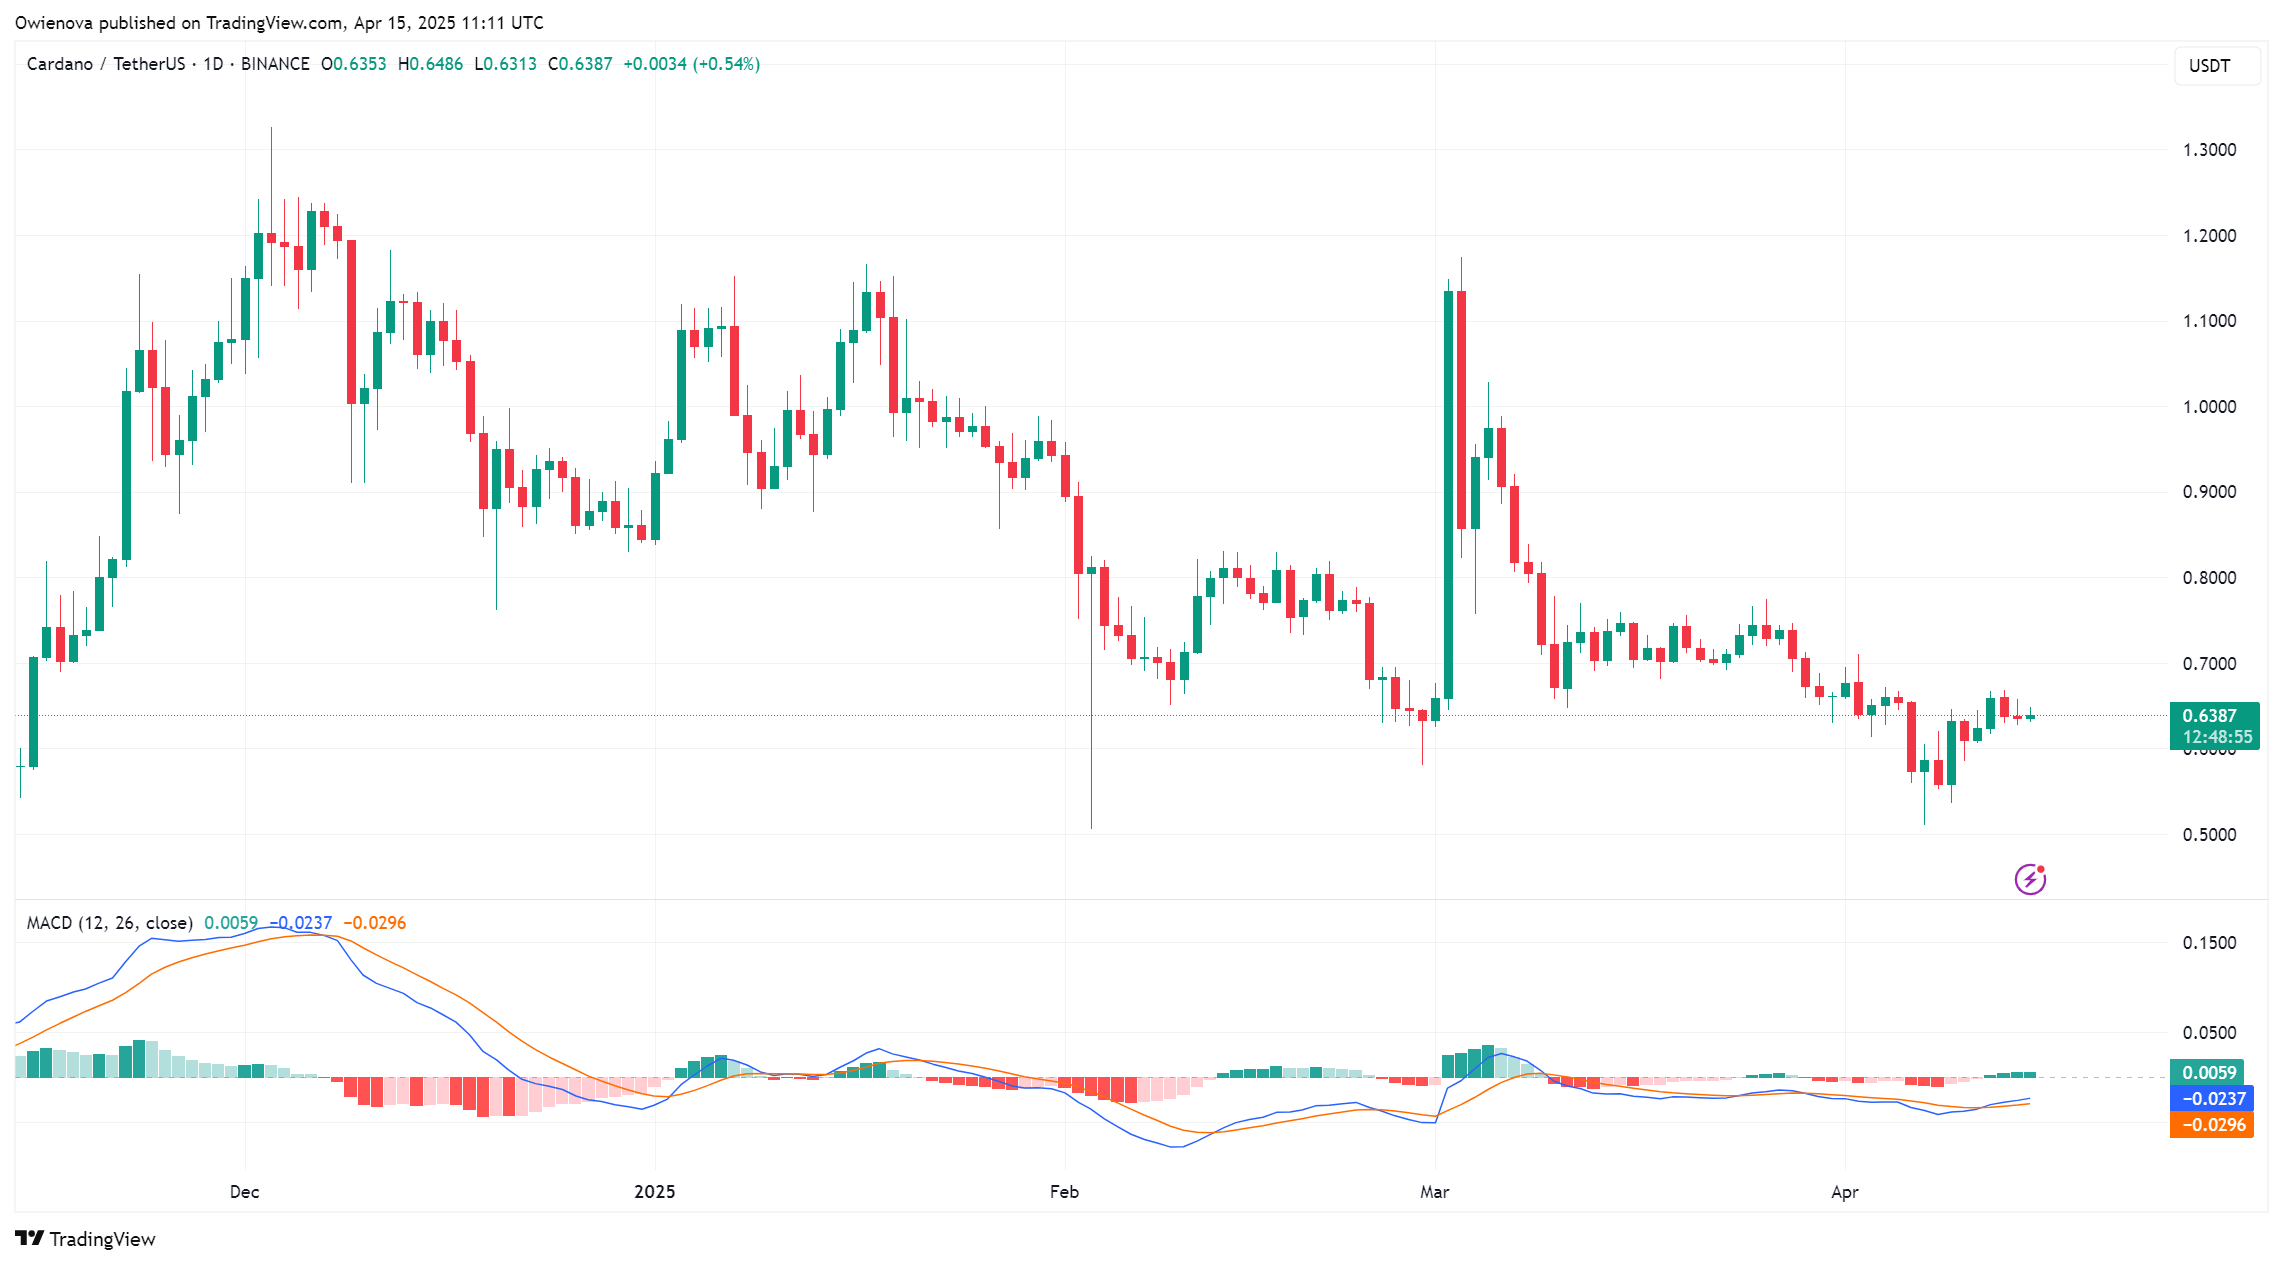
- ADA has established a support base after recent market volatility.
- Current price action indicates rising lows and increasing buying interest.
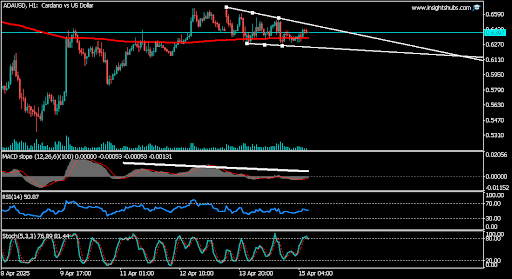
- Consolidation within a descending triangle pattern on the 1-hour chart suggests possible breakout scenarios.
- Price is near the lower boundary of the triangle at approximately $0.6292, which has provided support.
Anderson notes that ADA remains below the 200-period moving average, indicating short-term bearish pressure. The 4-hour chart reflects attempts at recovery, with higher lows suggesting bullish momentum. However, significant resistance exists at $0.6974.
The following factors are crucial for ADA's next move:
- A breakout above $0.6974 could confirm a bullish trend.
- If support at $0.6292 holds and volume increases, ADA may break out upwards.
- If support fails, a deeper correction toward $0.60 or $0.58 could occur.