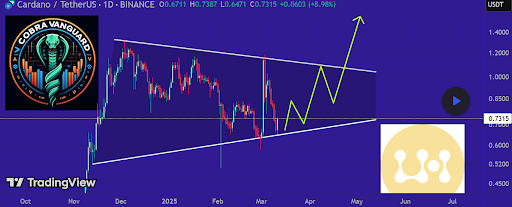
Cardano Forms Bullish Triangle Pattern Indicating Potential 100% Price Rally
Cardano's price has shown signs of recovery after a recent dip, gaining nearly 1% in the last 24 hours and reaching an intraday high of $0.7613. The cryptocurrency is currently trading within a triangle pattern, which may indicate a potential rally toward $1.5.
Key Points
- Cardano has been trading within a triangle formation since November 2024, defined by lower highs and higher lows.
- The latest price drop brought Cardano down to the lower boundary of the triangle at $0.647.
- A recent push could suggest the start of a move toward the upper resistance level of the triangle.
- If Cardano breaks above this upper trendline, it could potentially surge towards $1.5, representing a 100% increase from current levels.
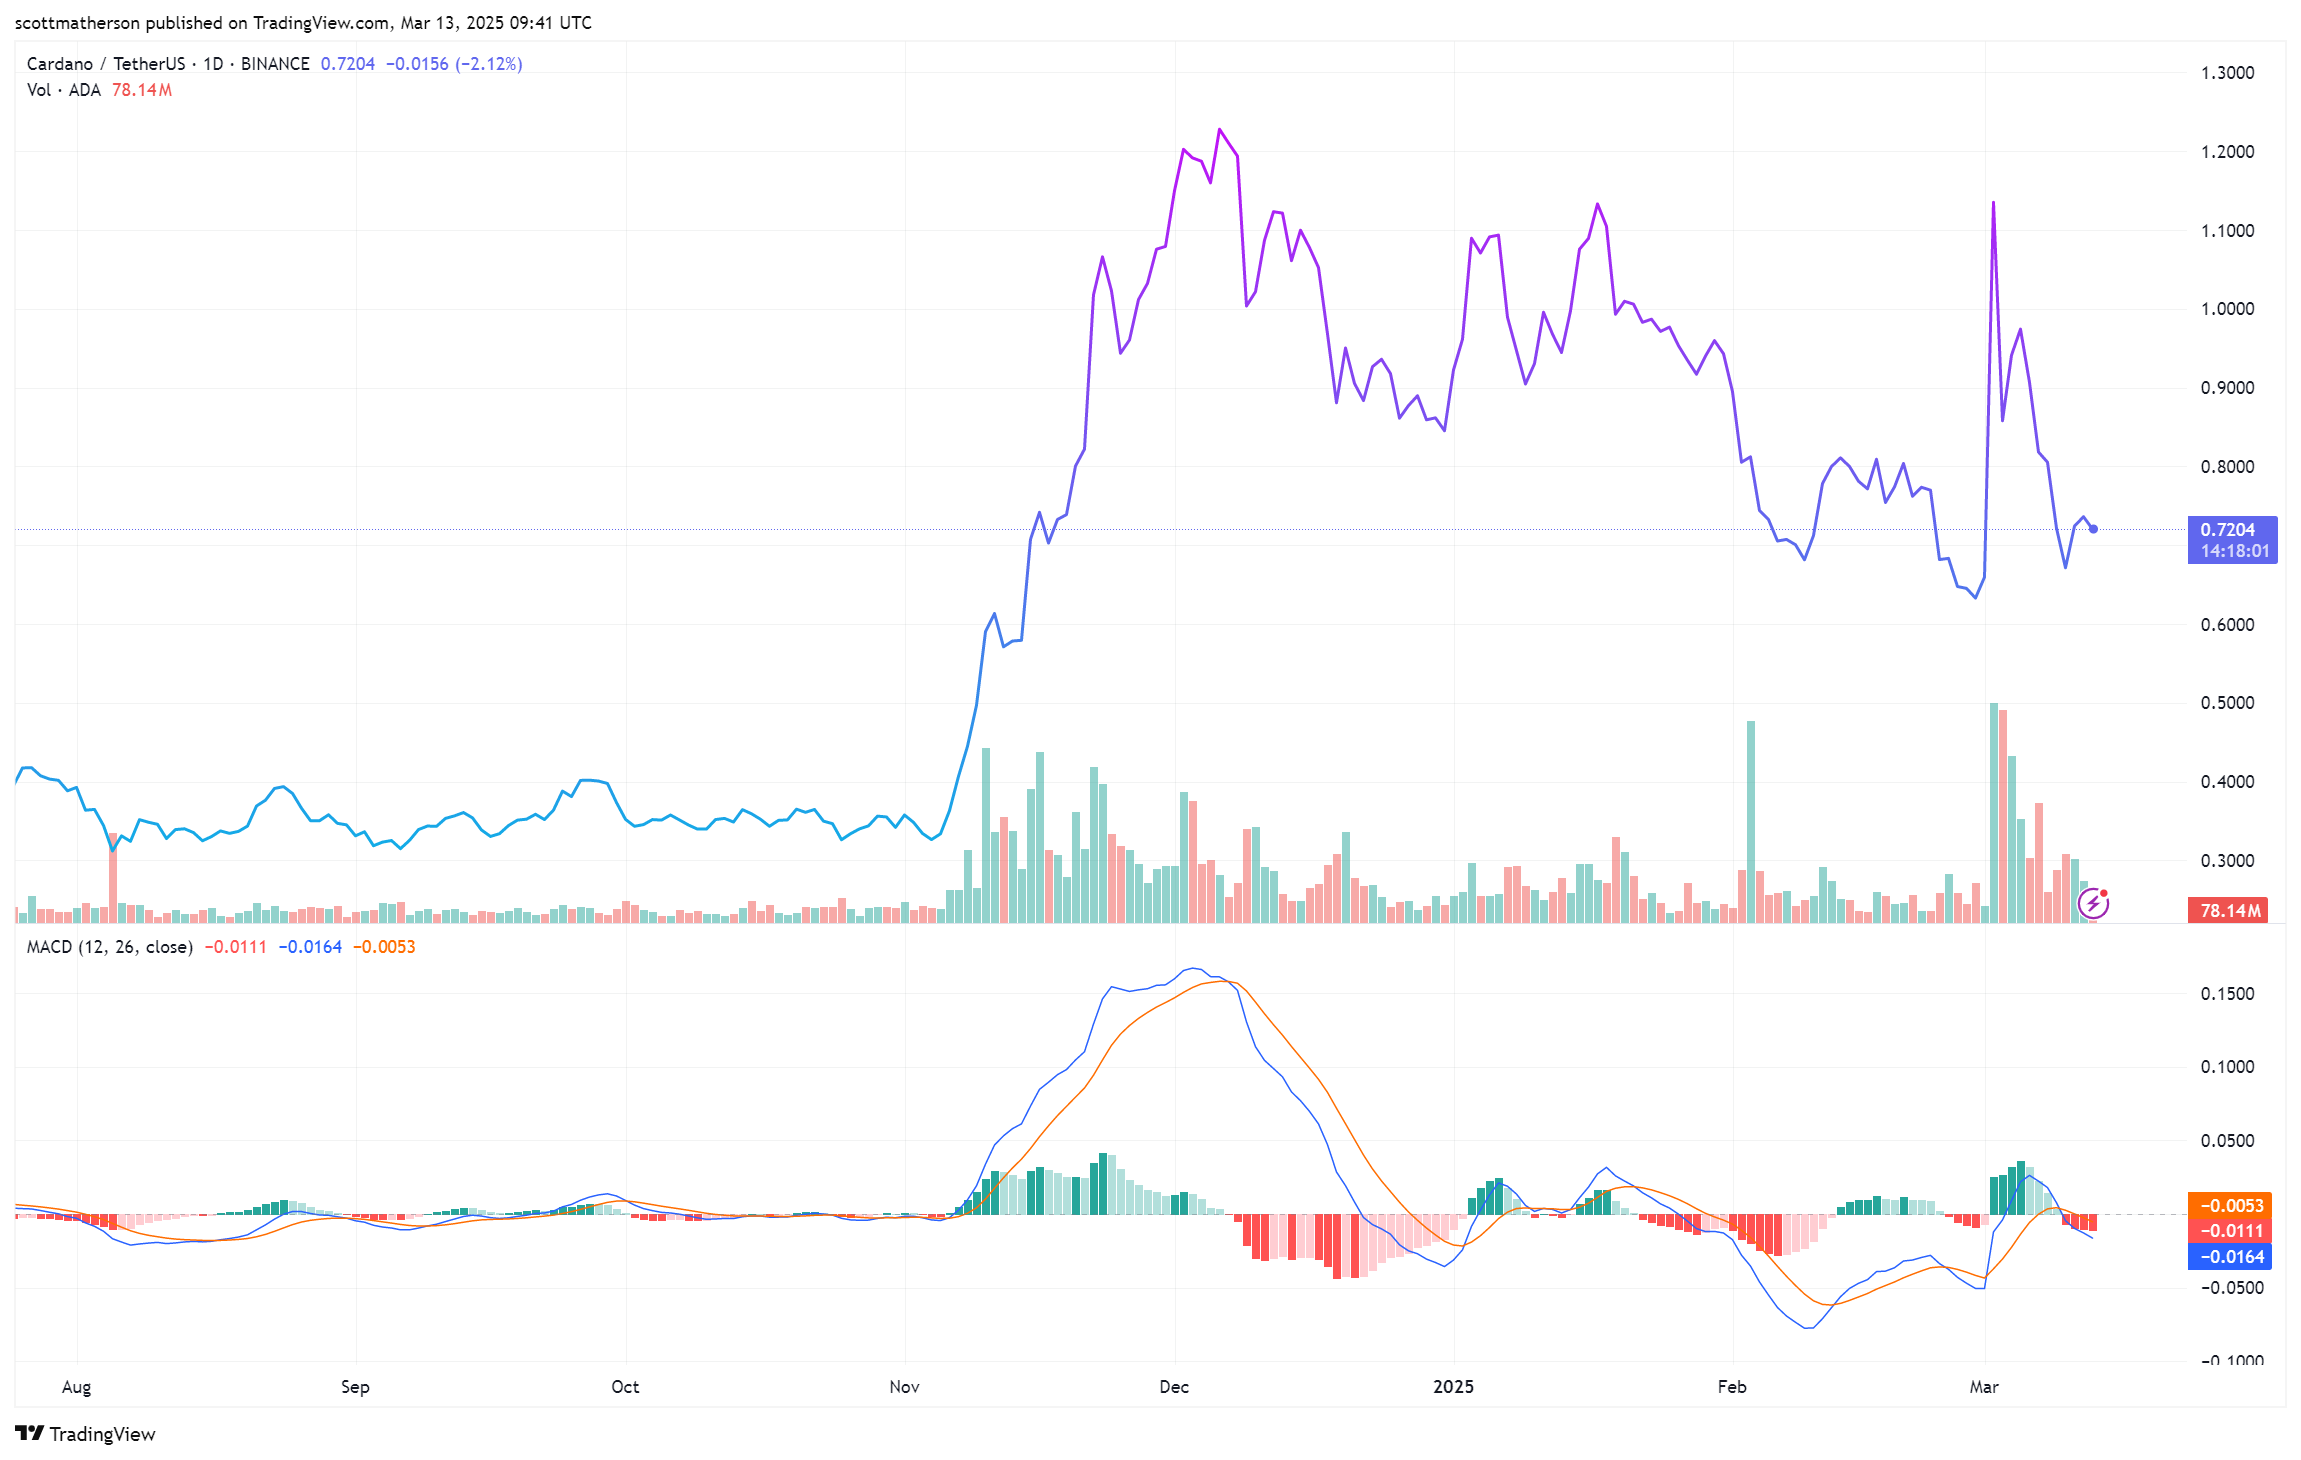
- The upper trendline has been tested around three times since November, making future approaches crucial for price movement.
- Market sentiment and Bitcoin's performance will significantly impact Cardano's ability to reach the projected target.
- As of now, Cardano is trading at $0.7205, with a possibility of retesting the support trendline soon.