Sep 26, 2025
14 1
Chainlink Triangle Breakout Could Target $100, Analyst Suggests
An analysis of Chainlink (LINK) suggests a potential breakout from a triangle pattern could target a price near $100.
Triangle Pattern Analysis
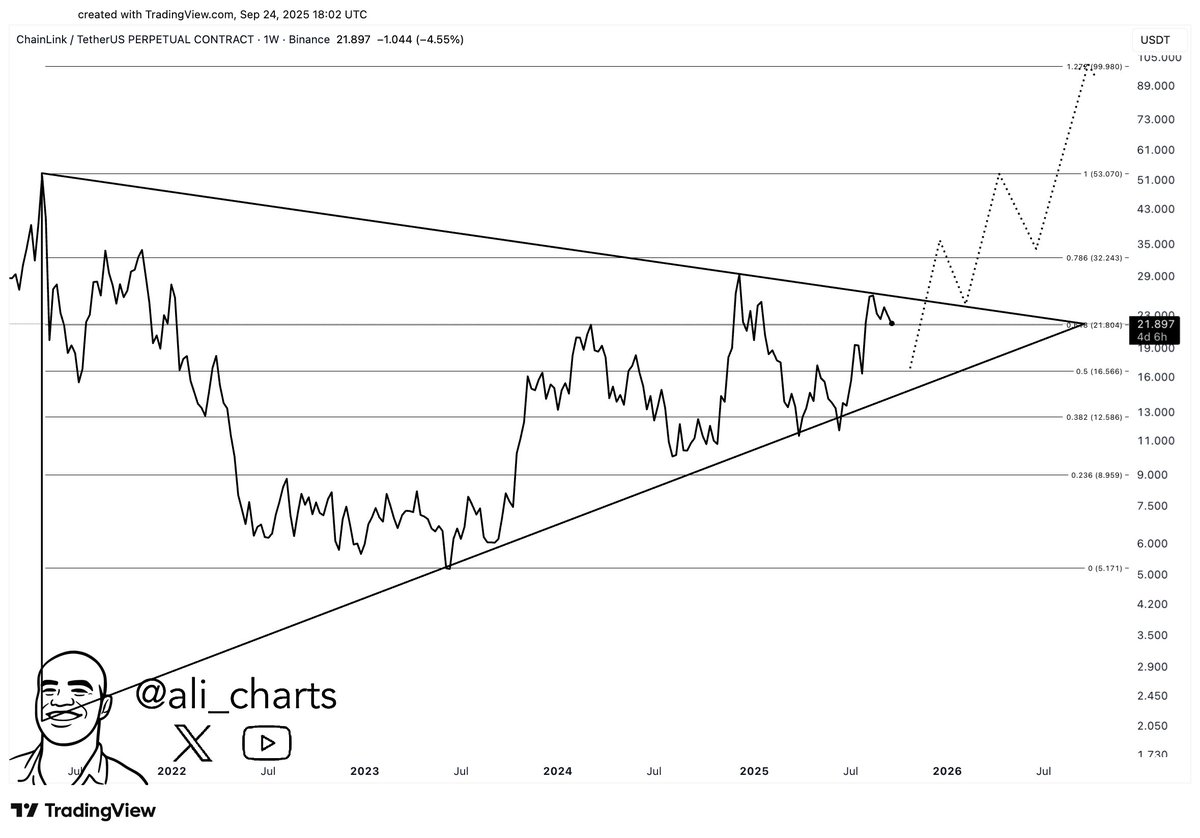
- Analyst Ali Martinez identifies a triangle pattern in Chainlink's weekly price chart.
- The pattern is between a symmetrical and ascending triangle, with an upward angle.
- Currently, LINK has retested the upper trendline but found resistance.
Potential Price Movement
- A drop to $16 may align with the 0.5 Fibonacci retracement level, offering potential buying support.
- If LINK rebounds from this level, it could break out of the triangle.
- The analyst targets the 1.272 Fibonacci extension level at approximately $100 if a breakout occurs.
Current Market Status
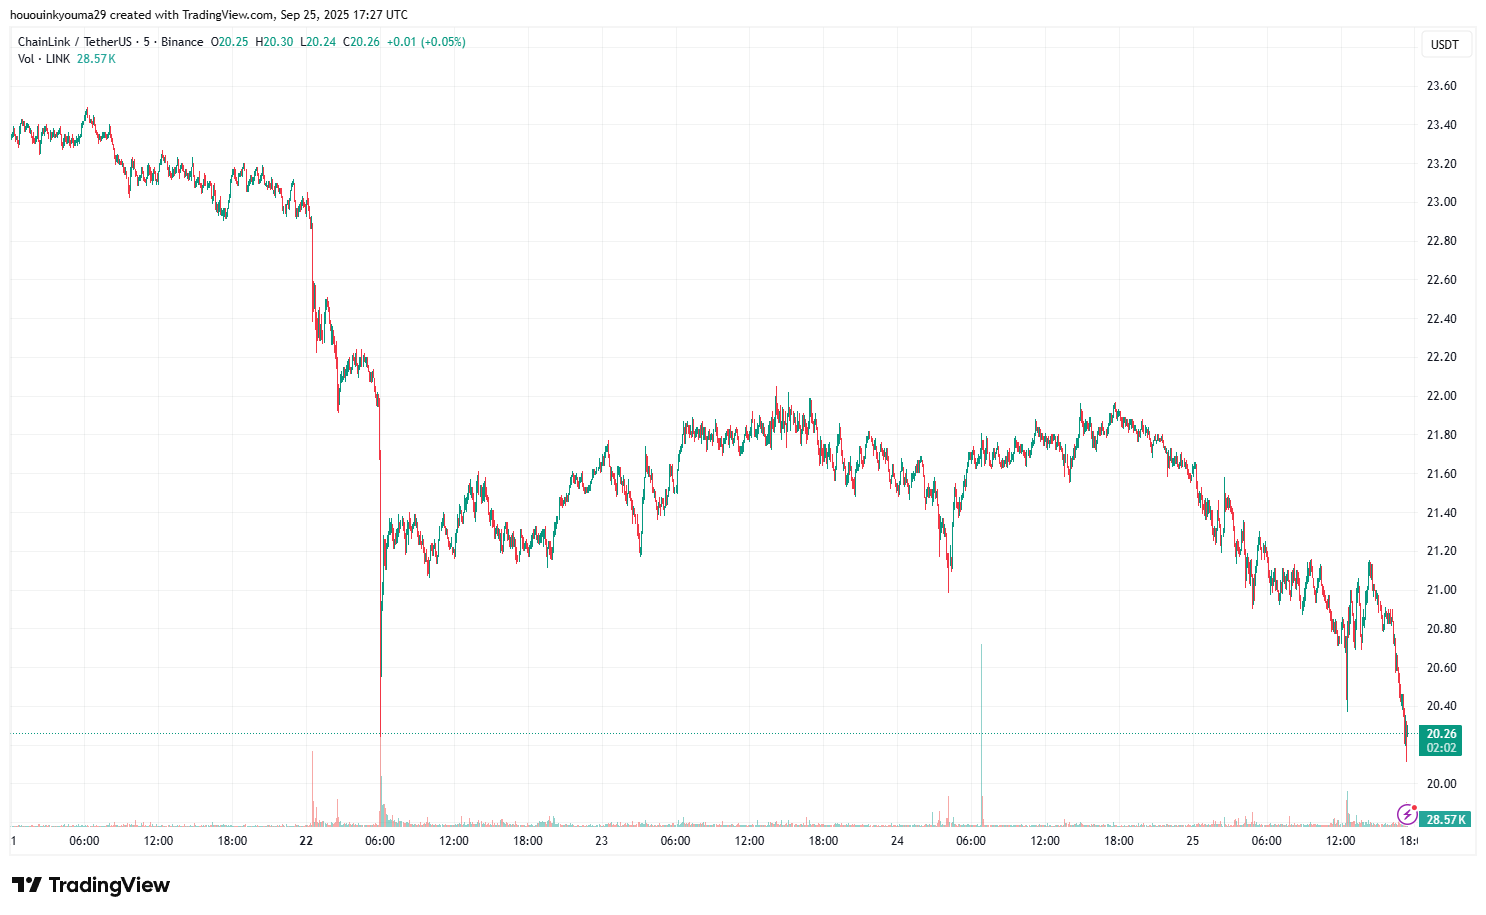
- Chainlink is trading around $20.25, having decreased by over 17% in the past week.