Jan 21, 2026
1 0
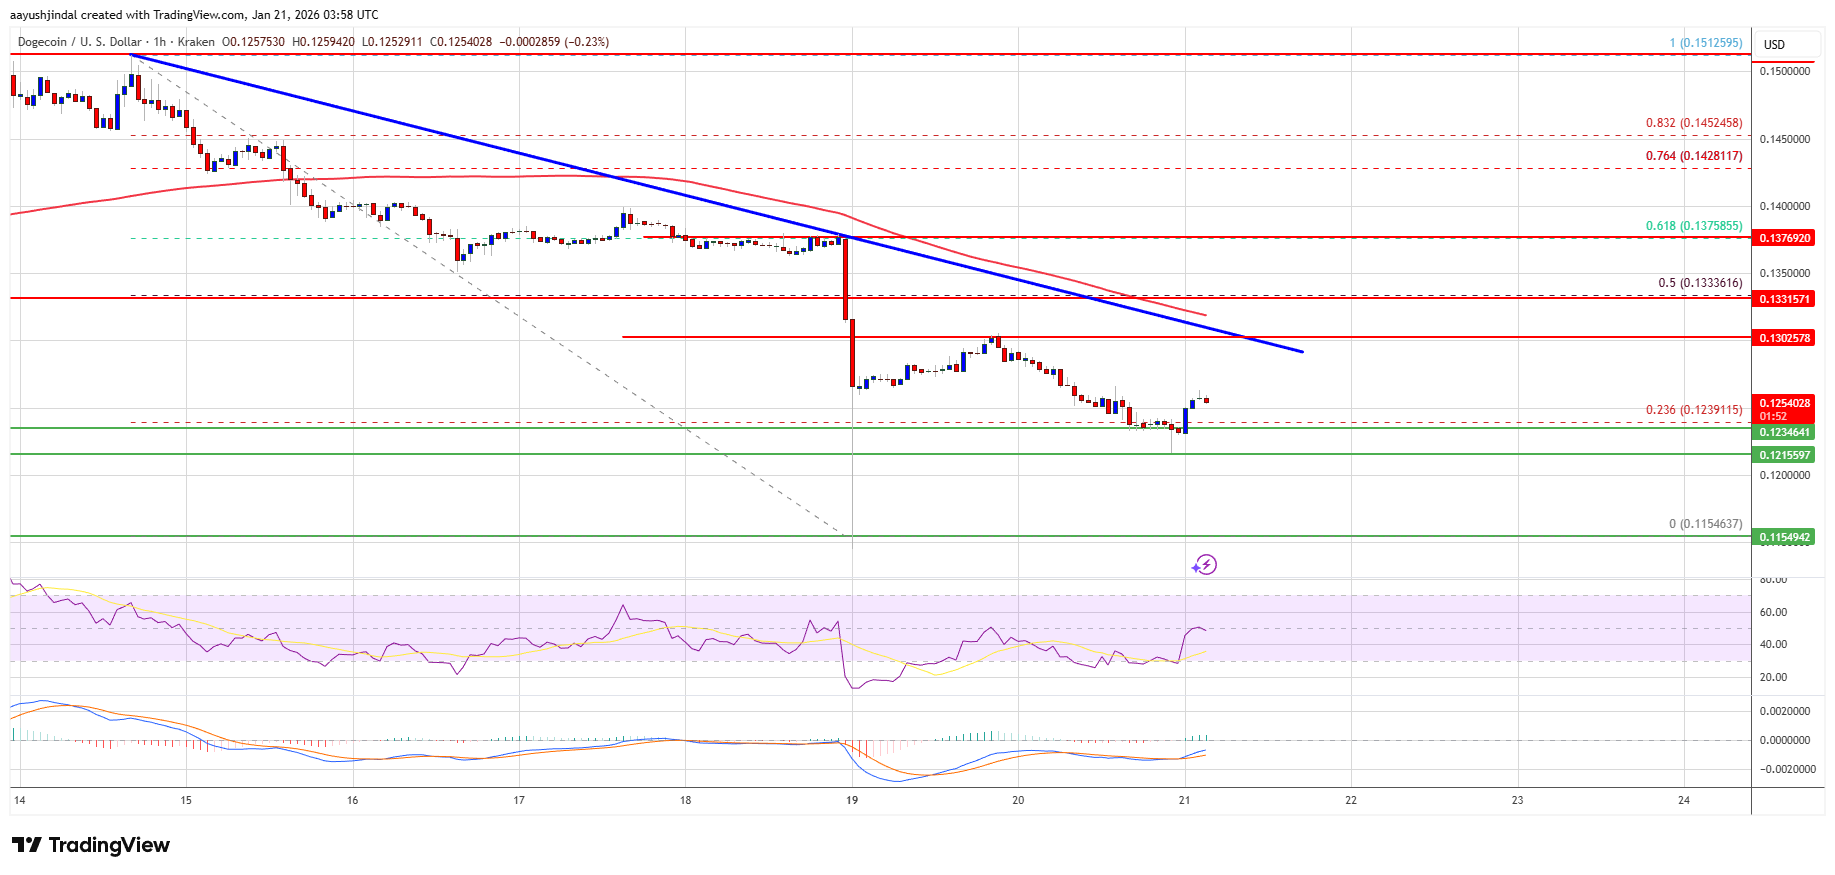
Dogecoin Drops Below Key Support, Faces Resistance at $0.130
Dogecoin Price Analysis
- DOGE experienced a decline below the $0.1200 level against the US Dollar.
- The price is trading under $0.1280 and the 100-hourly simple moving average.
- A bearish trend line with resistance at $0.130 is forming on the hourly chart of DOGE/USD.
- The price might extend losses if it remains below $0.1300 and $0.1320.
Current Price Movement
- Dogecoin fell below the $0.1280 and $0.1220 support levels, hitting a low near $0.1155.
- There was a brief recovery above $0.120, climbing past the 23.6% Fib retracement level from $0.1512 to $0.1155.
- Resistance levels are at $0.1280, $0.130, and $0.1330 (50% Fib retracement).
- If DOGE can close above $0.1330, potential targets include $0.1375 and $0.140.
Potential Decline
- If DOGE fails to break above $0.1300, further declines are possible.
- Support levels are at $0.1215, $0.1200, and main support at $0.1150.
- A break below $0.1150 could lead to a drop toward $0.1120 or $0.1050.
Technical Indicators
- Hourly MACD: Losing momentum in the bearish zone.
- Hourly RSI: Below the 50 level.
- Major Support Levels: $0.1215 and $0.1200.
- Major Resistance Levels: $0.1300 and $0.1330.