Sep 12, 2025
7 0
Dogecoin RSI Signal Returns—Last Time It Sparked a 1,700% Rally
Dogecoin Analysis
- Dogecoin's monthly chart suggests a potential rally, with the stochastic RSI (stoch RSI) poised for an upward cross but not yet above the critical 20 threshold.
- Previous similar setups, where stoch RSI crossed above 20, resulted in massive rallies—1,852% gain in 2017 and 1,751% subsequently.
- The current cycle is showing a cleaner sequence, with earlier advances of 280% and 497% after confirmed stoch RSI crosses.
- A new stoch RSI cross is forming, but significant bullish movement typically occurs once it surpasses the 80 level.
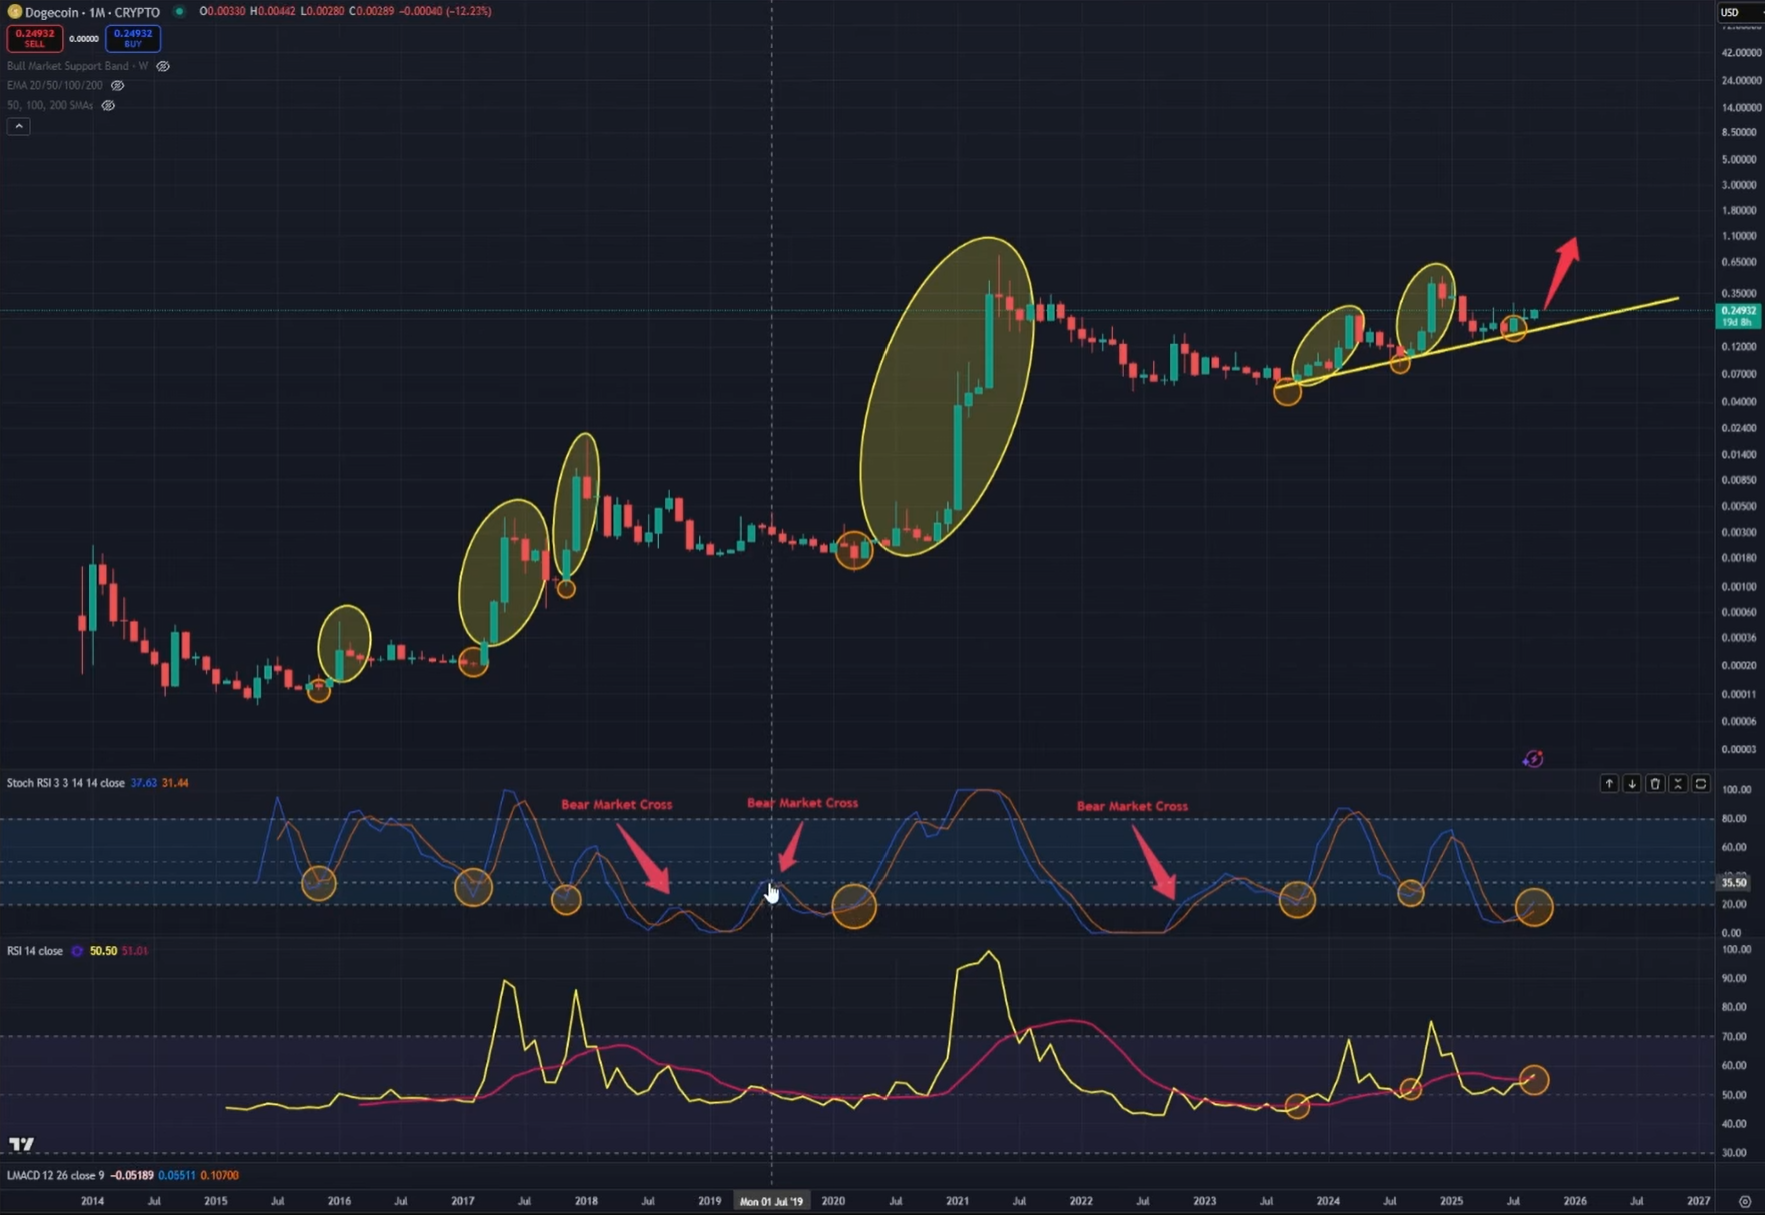
- Key technical indicators include RSI crossing above its moving average at inflection points and defending a long-term trend line with higher lows.
- Macro conditions, especially US monetary policy, play a crucial role. Rate cuts could lead to altcoin dynamics favoring Dogecoin, while hawkish policies or inflation increases pose risks.
- Seasonality indicates potential near-term volatility, with the Federal Reserve's upcoming meeting influencing market sentiment.
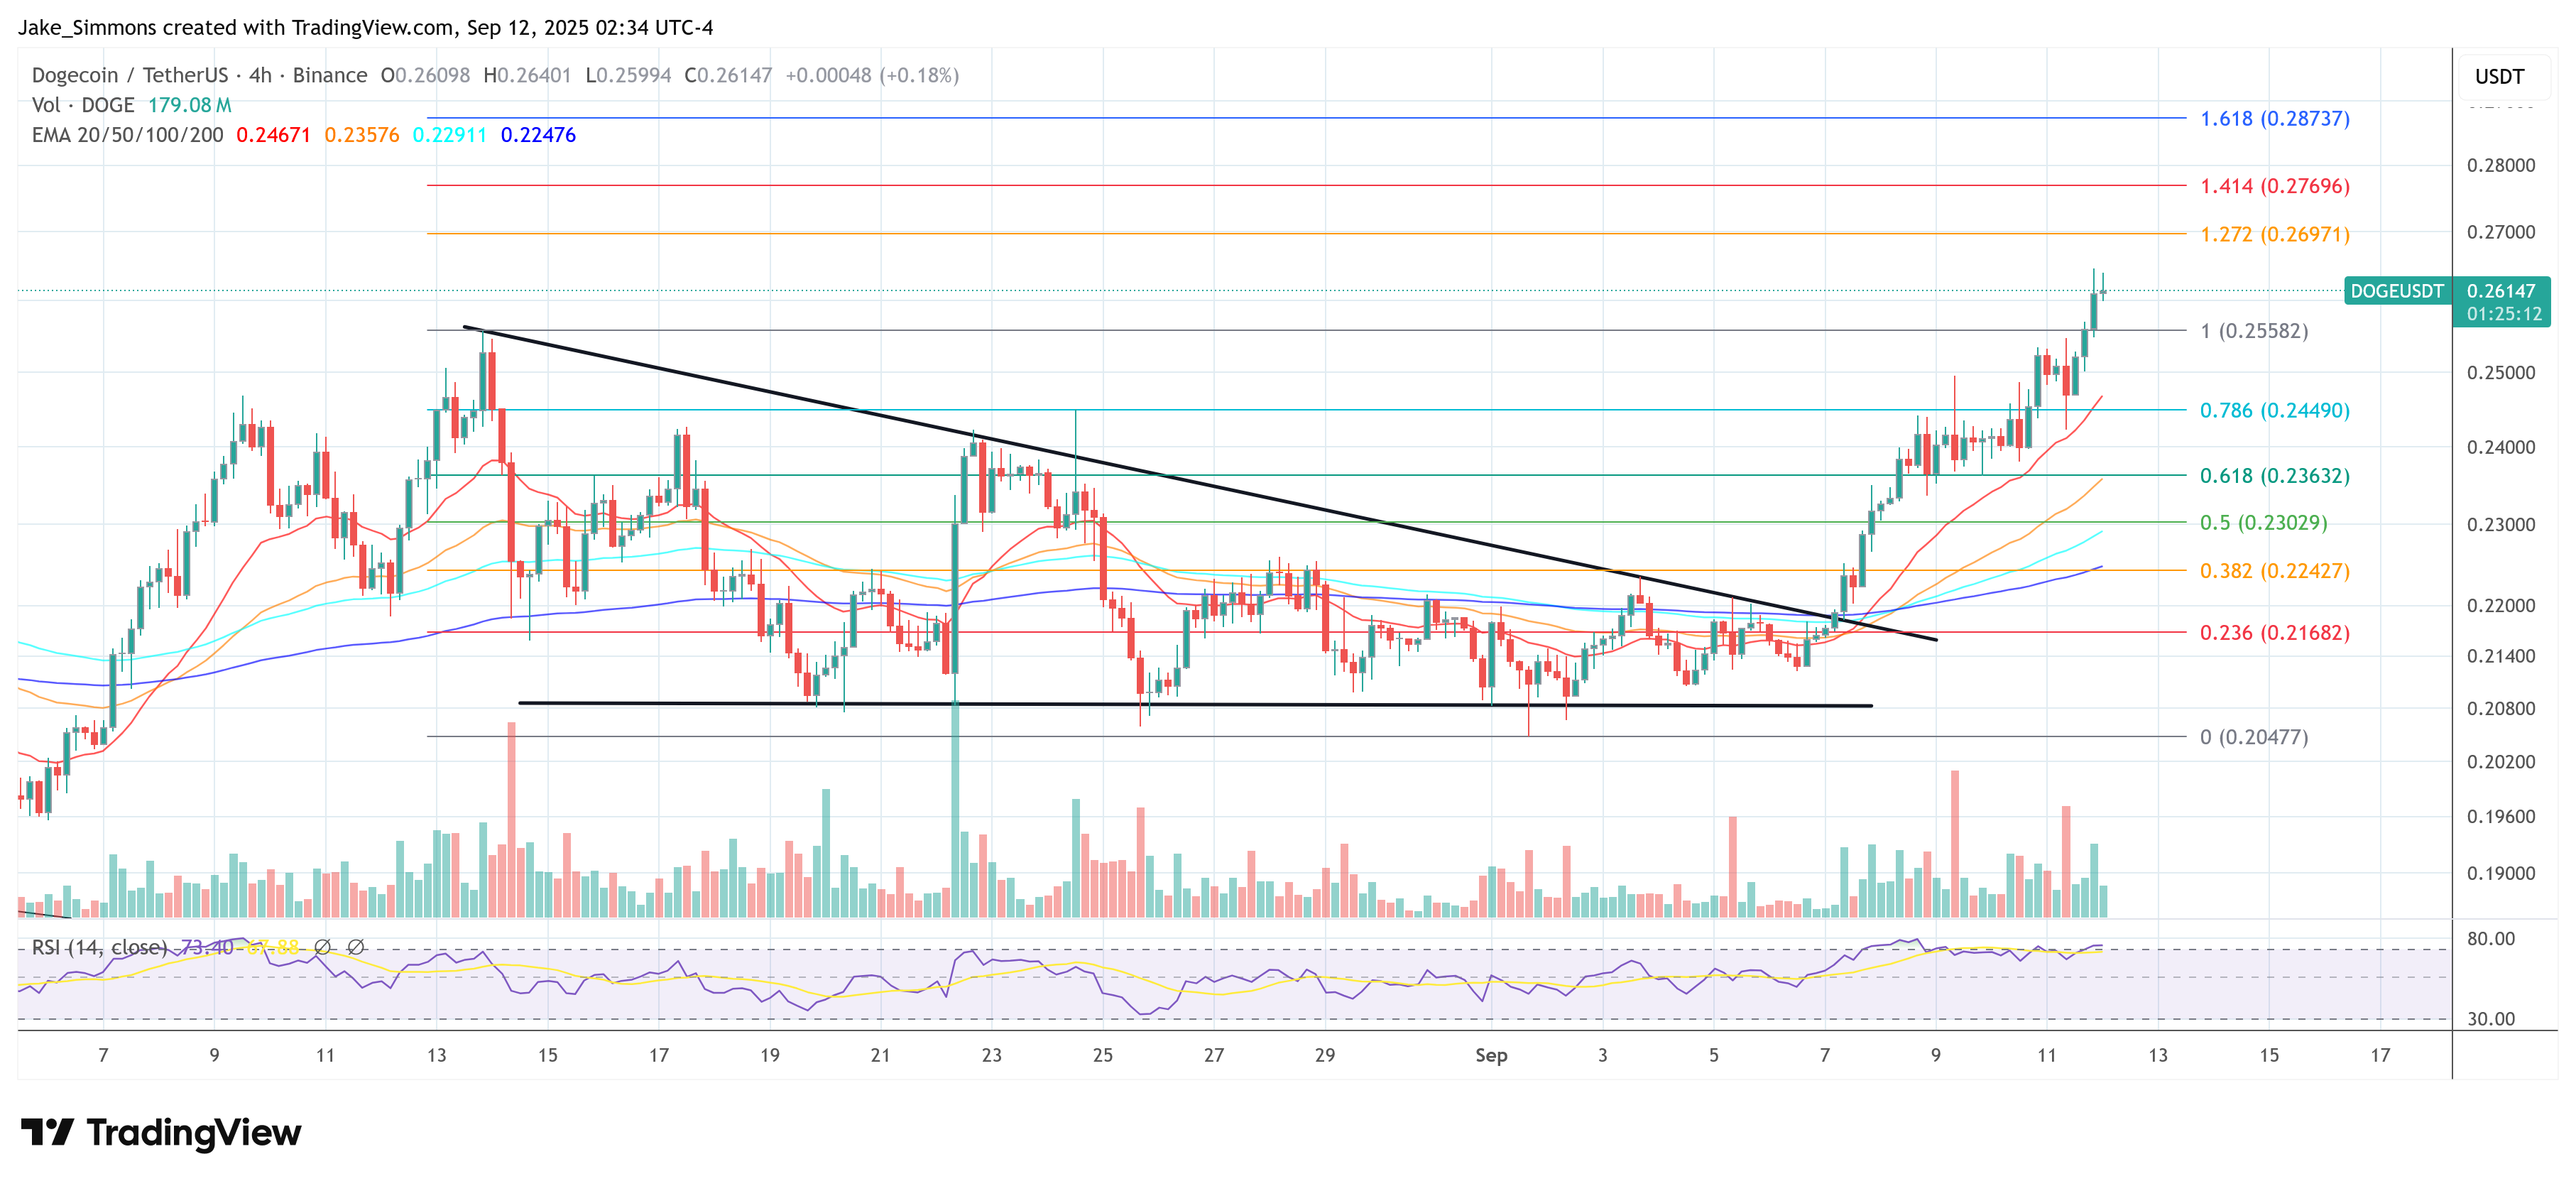
Dogecoin currently trades at $0.261, with the charts indicating potential for a larger move upwards if the momentum indicators align positively.