Dec 29, 2025
9 1
Ethereum Descending Triangle Signals Potential Drop Below $2,800
Ethereum has faced significant challenges since reaching an all-time high in August 2025. In Q4 2025, the price dropped over 29%, with technical indicators suggesting further declines.
Current Ethereum Price Trends
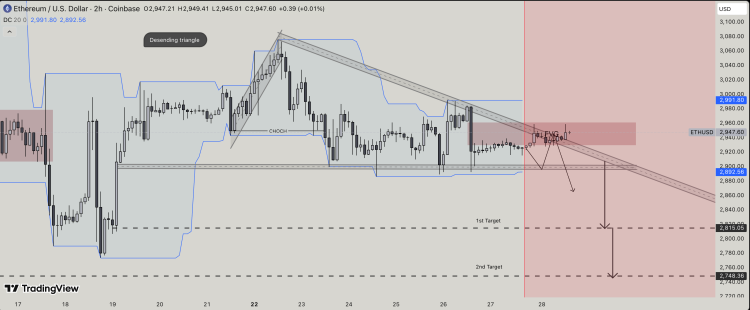
- The Ethereum price chart reveals a descending triangle structure, indicating potential continued downtrend.
- The asset's price fell below a descending trendline, maintaining a three-month downward trajectory.
- A Change of Character (CHoCH) suggests a shift from bullish to bearish sentiment.
- Resistance is strong at the $3,000 level, with trading confined within a Fair Value Gap between $2,930 and $2,960.
Potential Downside Targets for ETH
- If the downward trend continues, the first support target is $2,815.
- Breaking this could lead to a second target of $2,748, a major demand zone potentially triggering buying pressure.