Jan 30, 2025
3 0
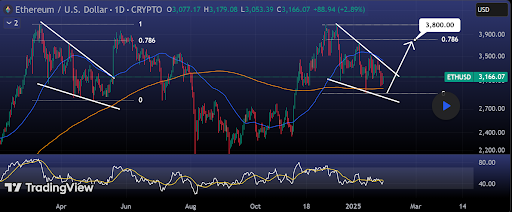
Ethereum’s Price Shows Bullish Falling Wedge Pattern Indicating Potential 20% Rally
Ethereum is currently showing signs of a potential breakout, as it moves within a falling wedge pattern on the daily chart. This pattern is considered bullish and may push Ethereum's price towards $3,800 if historical trends continue.
Key Points
- The falling wedge is forming between the 50-day and 200-day moving averages.
- Ethereum has underperformed compared to other cryptocurrencies this cycle.
- The current price trend exhibits lower highs and lower lows typical of a falling wedge.
- A similar pattern in March 2024 led to a significant price increase.
- If the wedge leads to a breakout, Ethereum could see a 20% rise from its current level.
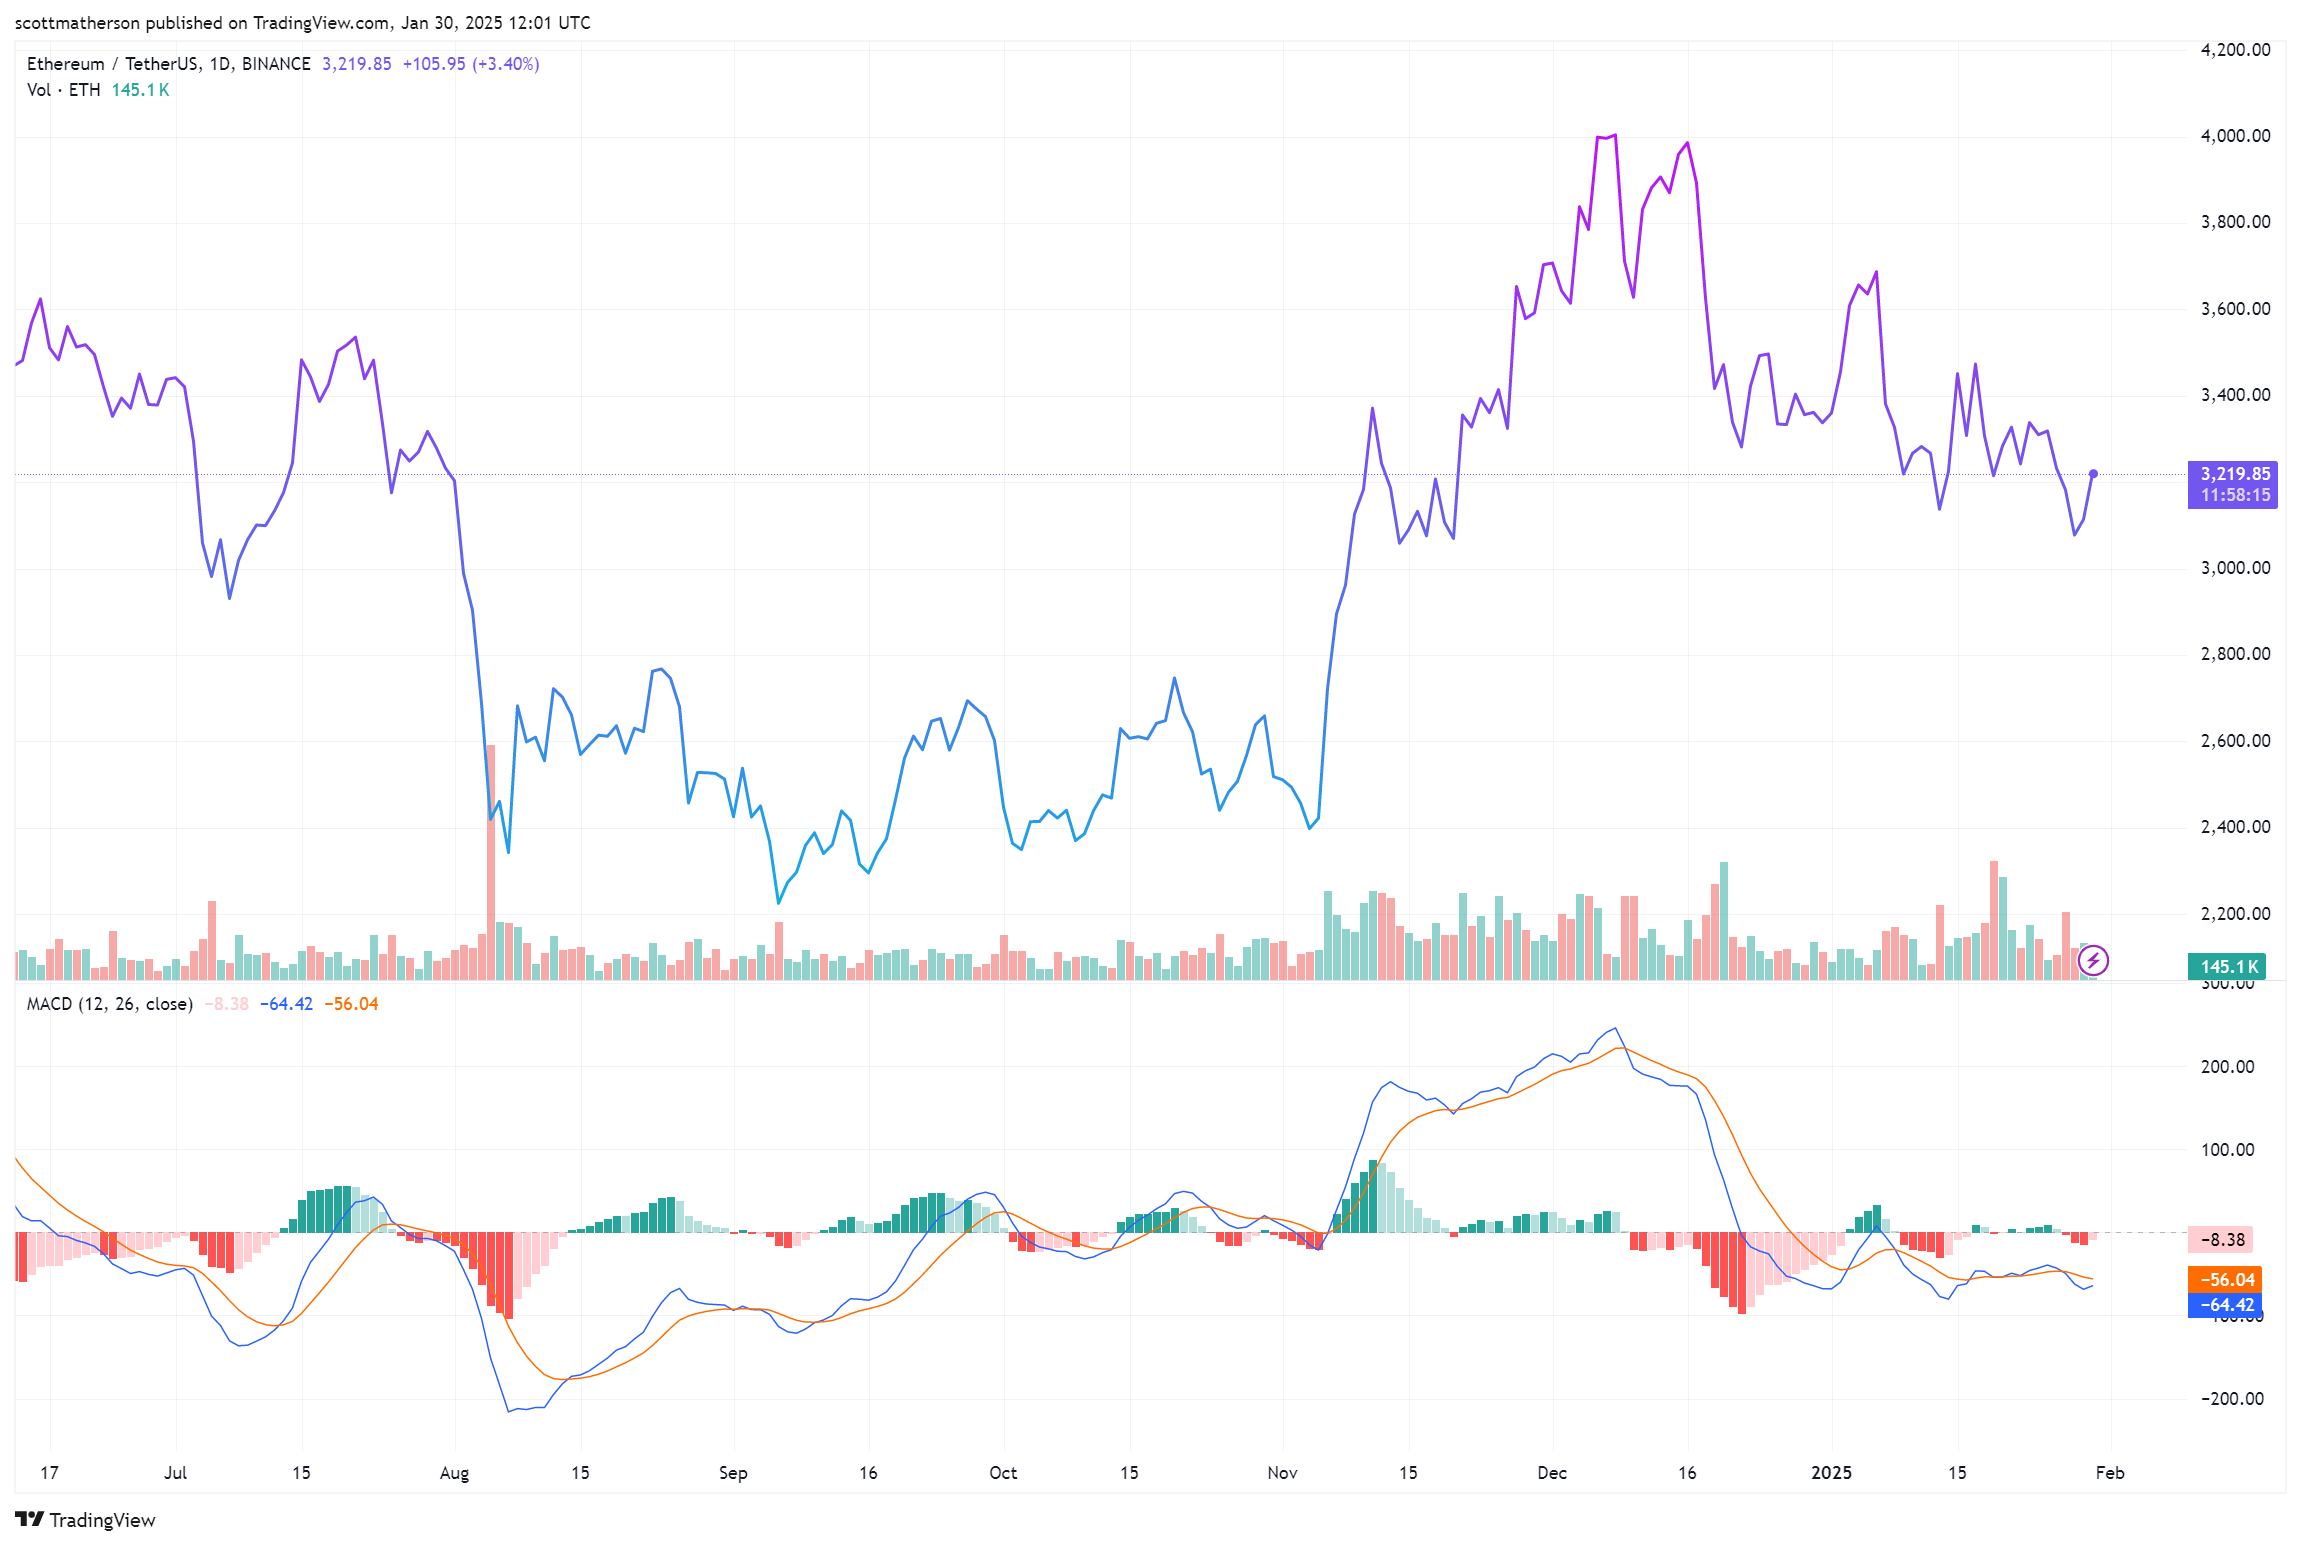
Ethereum is trading at $3,180, with resistance levels noted between $3,400 and $3,500. A failure to breach these levels may result in temporary setbacks, while clearing them could initiate a move towards $3,800.
Outlook
- A break above $3,500 might open paths to a more extended bullish trend.
- Success in reaching $3,800 could lead to further upward momentum toward $4,000.