Nov 24, 2025
9 0
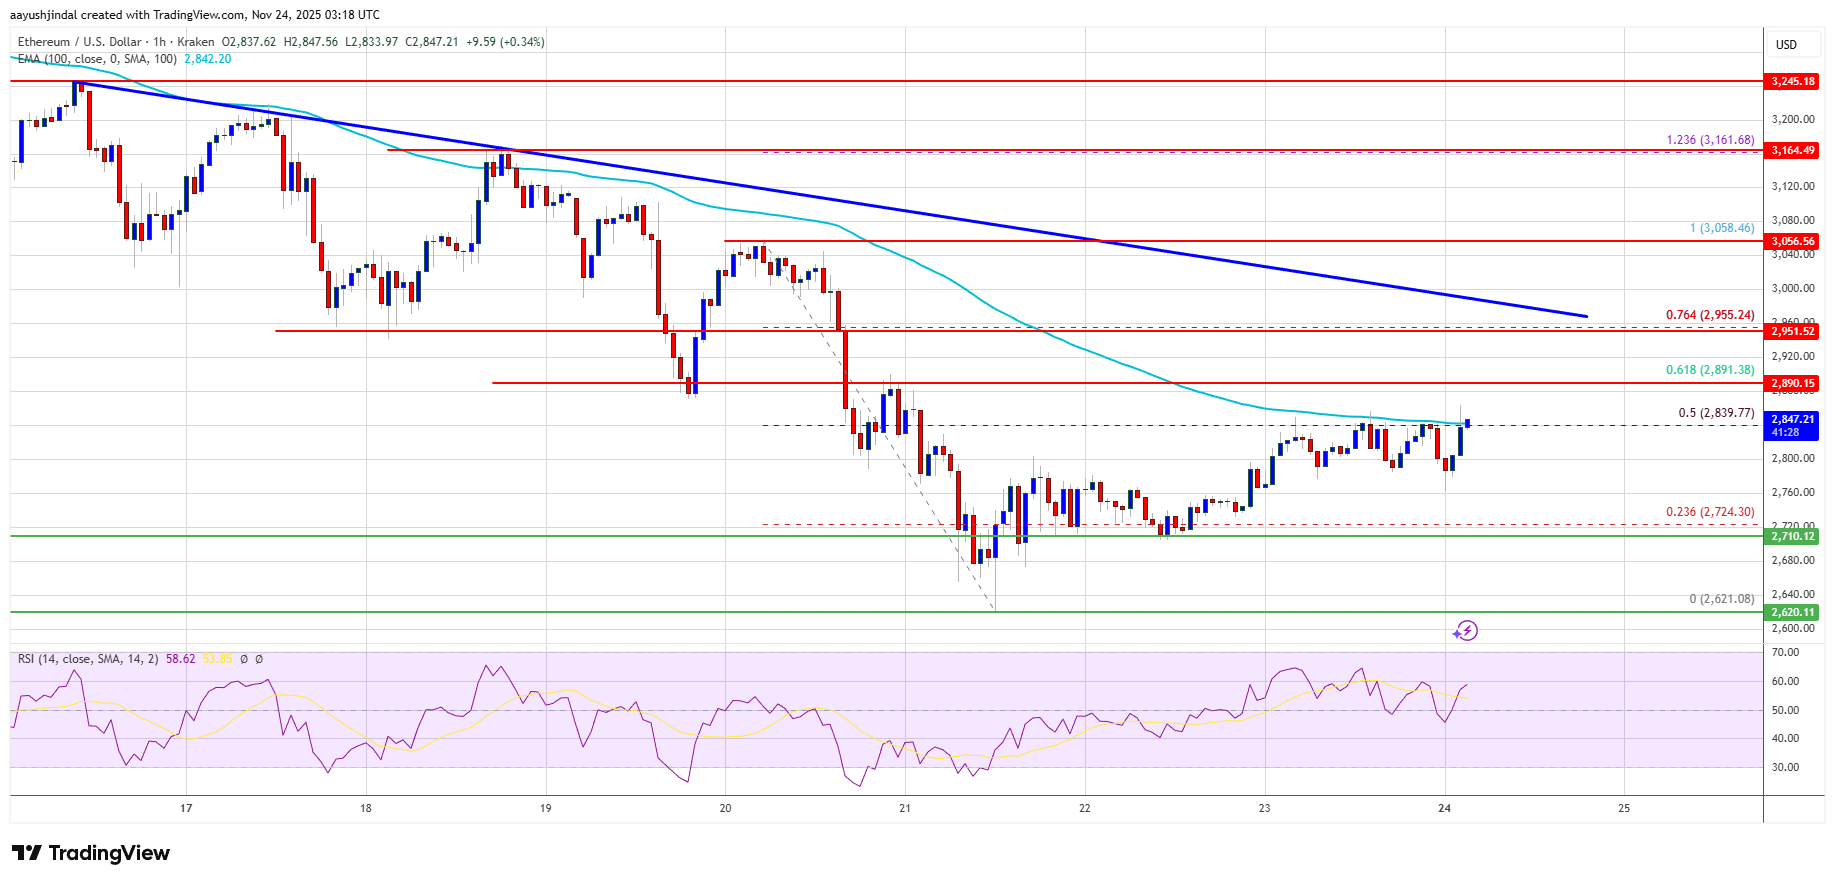
Ethereum Price Struggles Below $2,890 Facing Key Resistance Levels
Ethereum Price Analysis
- Ethereum's price dropped below $2,800, testing the $2,620 level.
- Currently trading near $2,840 and the 100-hourly Simple Moving Average.
- A key bearish trend line shows resistance at $2,960 on the hourly ETH/USD chart.
- If it settles below $2,720, further decline is possible.
Resistance and Support Levels
- Resistance levels: $2,890, $2,920, and $2,960. Breaking above $2,960 may push the price toward $3,020 or higher.
- Support levels: Initial support at $2,800, major support at $2,720. A move below $2,720 could lead to a drop toward $2,650 or lower.
Technical Indicators
- Hourly MACD: Losing momentum in the bearish zone.
- Hourly RSI: Above the 50 zone, indicating a potential recovery attempt.
The Ethereum price is attempting recovery, facing significant resistance near $2,890. Failure to clear this level might lead to further declines.