3 0
Ether Forms Ascending Triangle, Poised to Break Above $3,000
Technical Analysis of Ether (ETH)
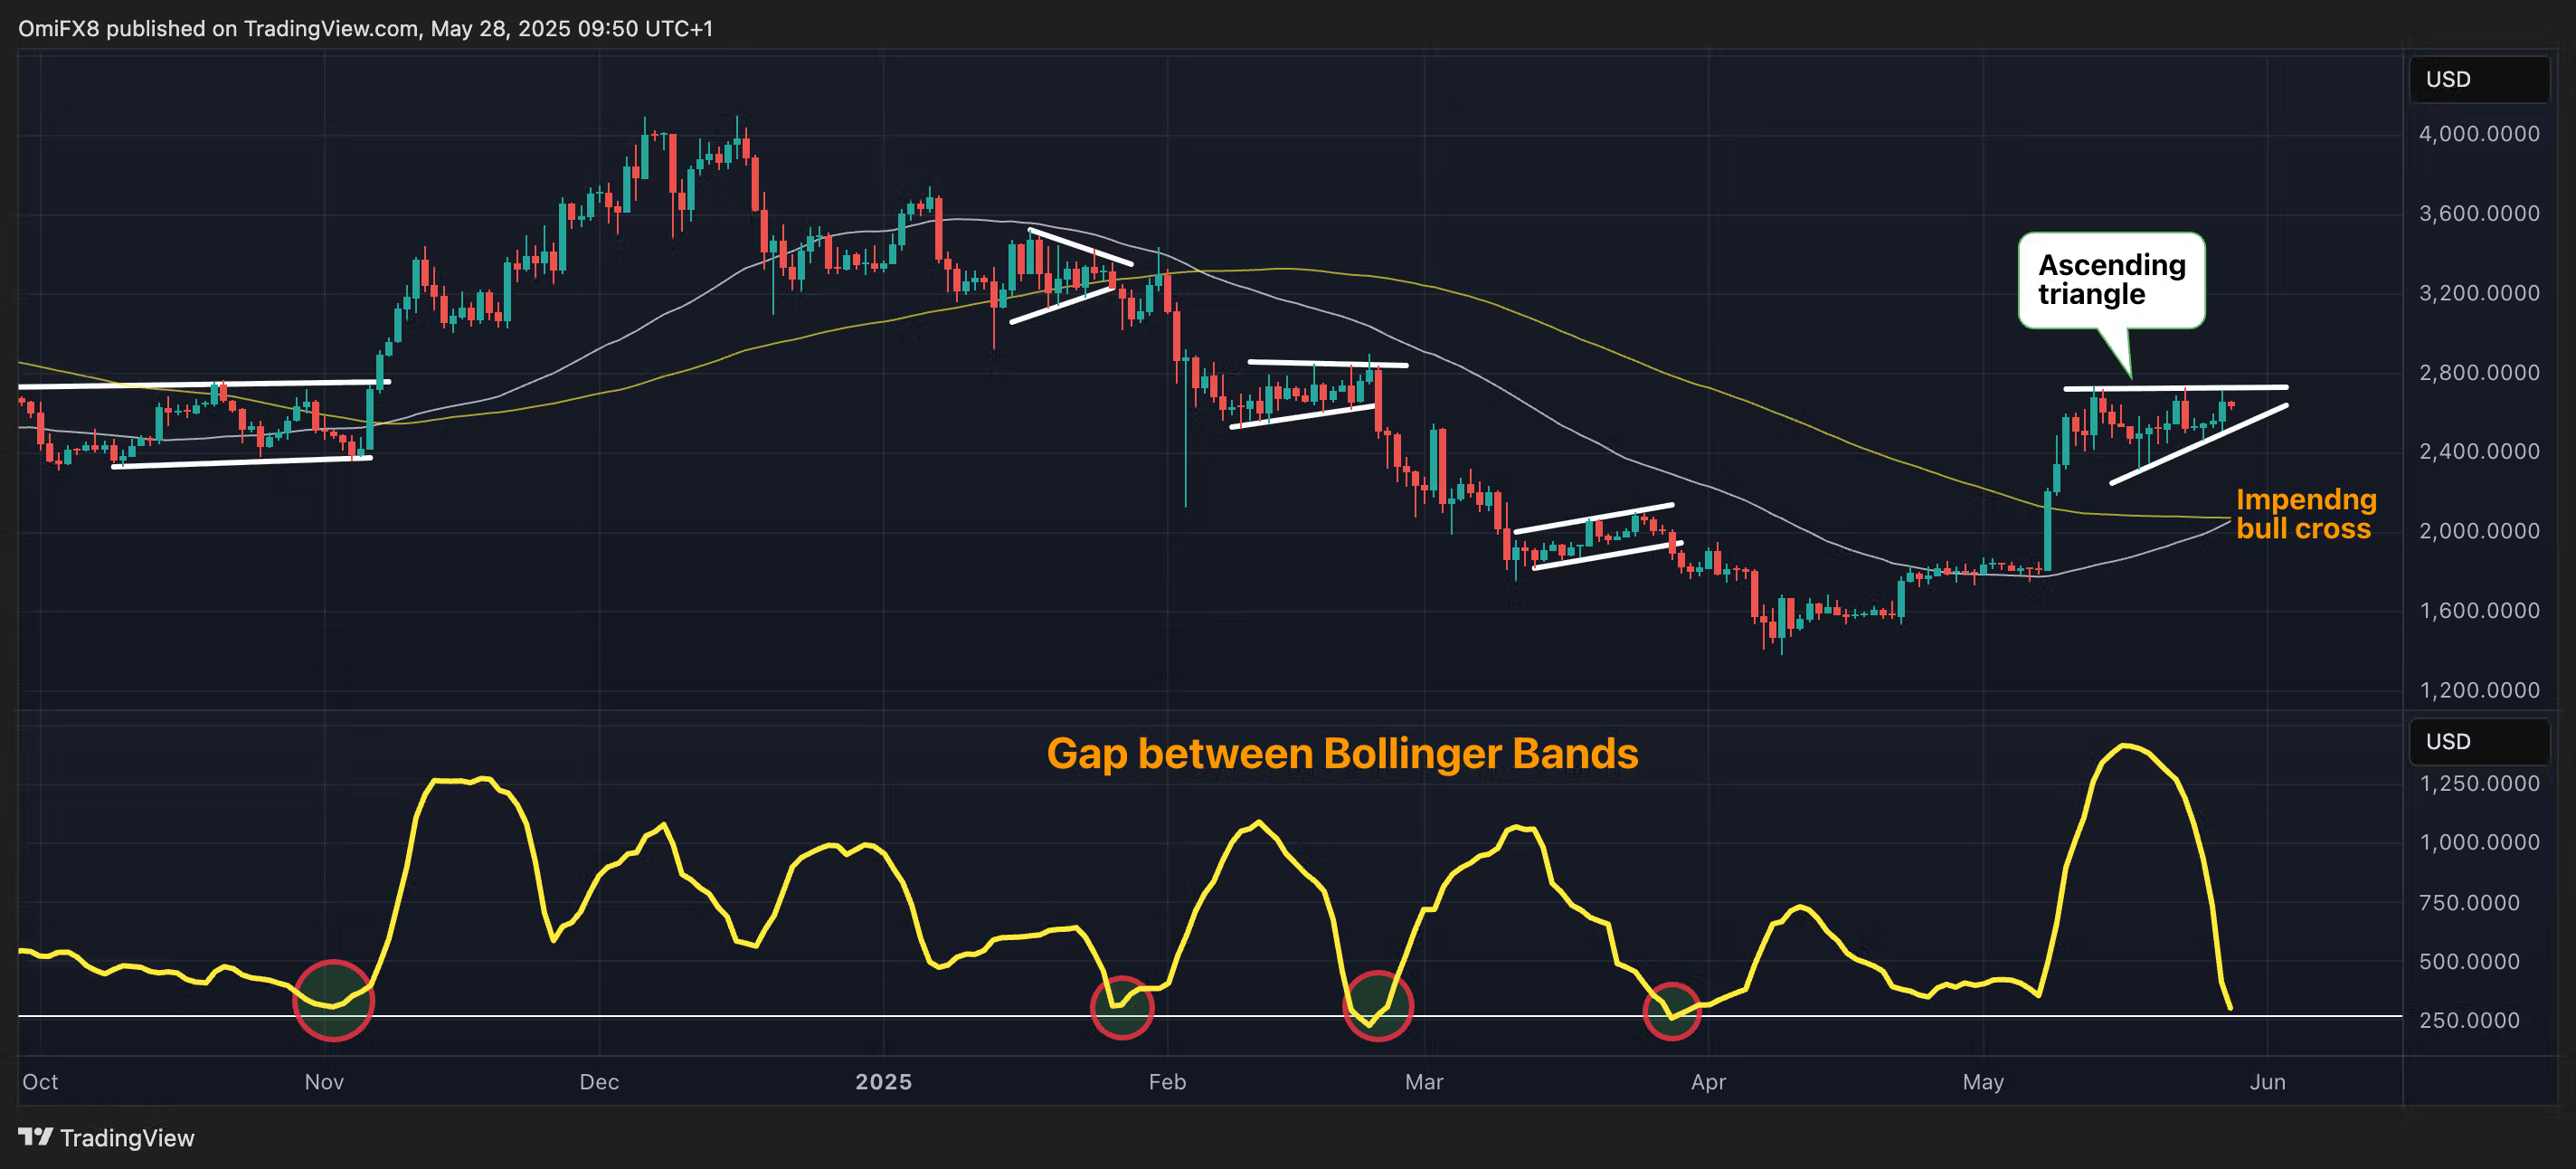
Ether is forming an ascending triangle pattern on the price chart, indicating a potential breakout above $3,000. Key points include:
- Resistance has been tested at $2,735 multiple times over the past two weeks.
- The support line is upward-sloping, showing rising buying pressure.
- A breakout from this pattern may signal a rally from April's lows near $1,390.
- The 50-day simple moving average (SMA) is nearing a crossover above the 100-day SMA, supporting bullish sentiment.
- Bollinger Bands have narrowed to approximately $250, suggesting an upcoming volatility spike.
- Historically, upward breakouts occur 77% of the time in such patterns.
A downside break could lead to increased selling pressure.
