Jun 18, 2025
6 0
Ethereum Struggles Below $3,000 as Whales Accumulate More ETH
Ethereum (ETH) is facing investor scrutiny as it trades at $2,533.31, down nearly 2% in 24 hours and about 10% over the past week. It struggles to break above the key $3,000 price level despite whale accumulation.
Key Technical Levels
- The 50-week exponential moving average (EMA) is a significant hurdle; historical breakouts above this level have led to gains between 25% and 135%.
- A breakout could target the $4,000 mark, aligning with the bullish flag formation on the weekly chart.
- ETH currently hovers around the 0.5–0.618 Fibonacci retracement zone ($2,276–$2,683), indicating an accumulation area.
- The RSI is at 51.97, suggesting neutral momentum, while the MACD shows early signs of bullishness.
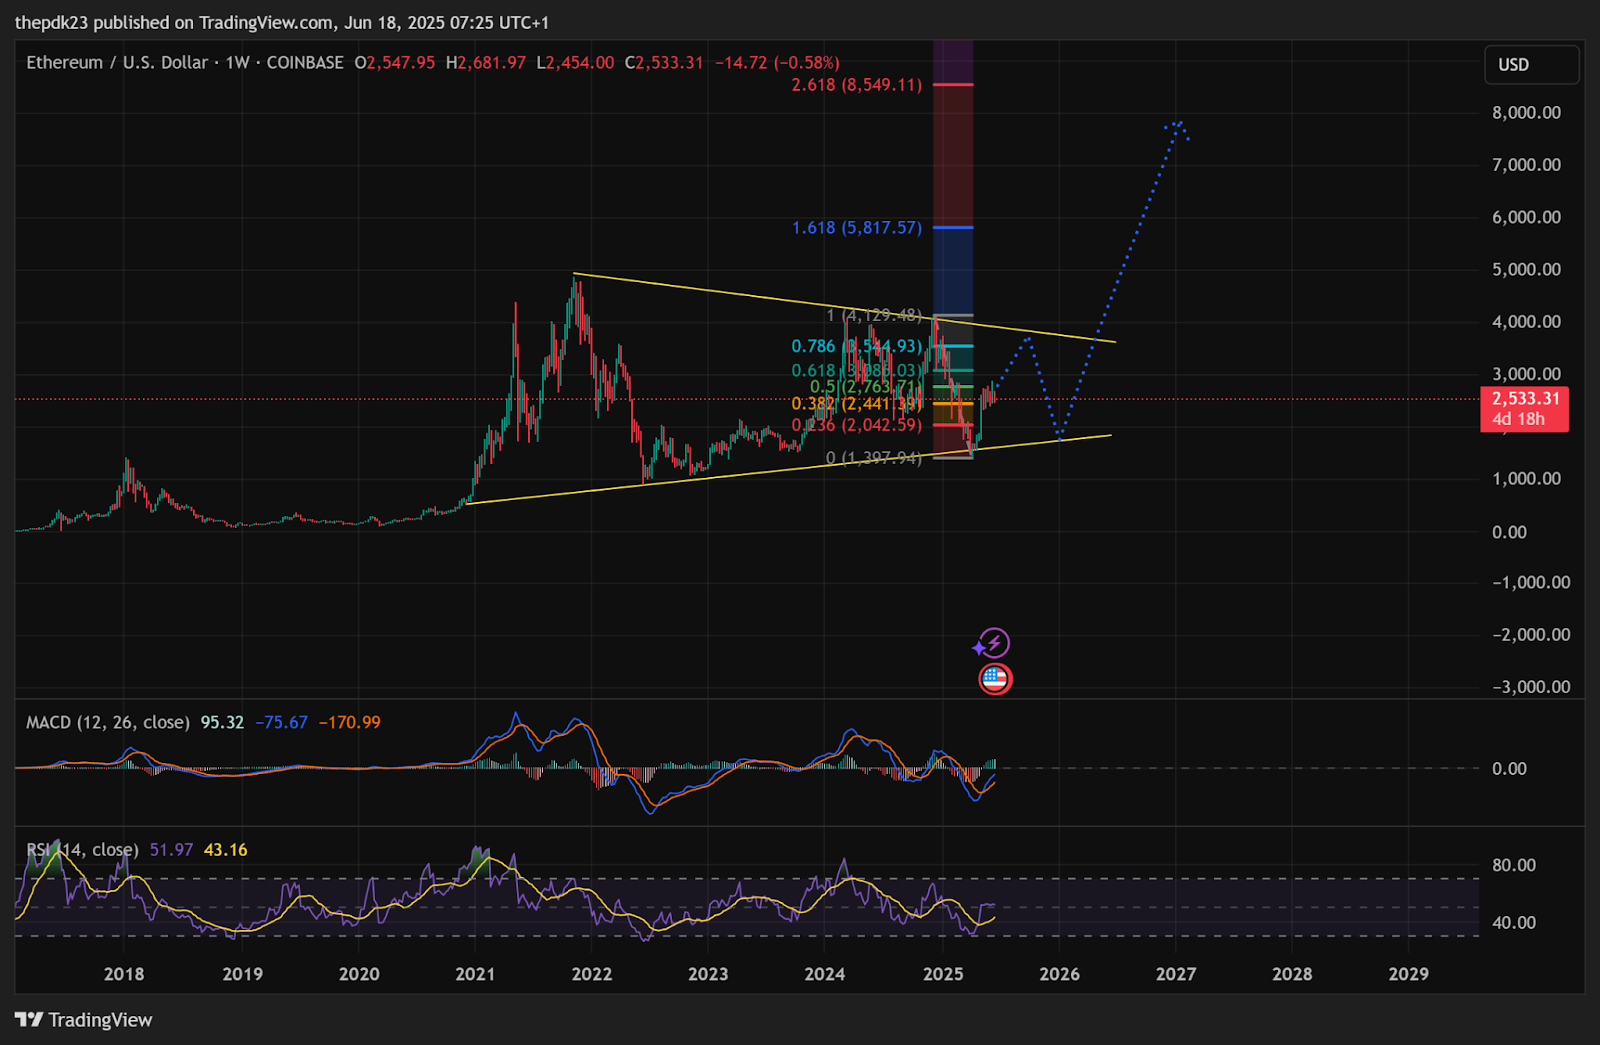
ETH Weekly Chart | Source: TradingView
Whale Accumulation
- Whale 0xd8d0 bought 15,000 ETH for $37.15 million at $2,477, accumulating a total of 85,465 ETH worth $221 million at an average price of $2,584 within a week.
- Another address, 0xf680, purchased 11,500 ETH ($29 million) over four days, indicating strong whale interest.
Supply Dynamics
- Over 35 million ETH are staked on the Ethereum network, representing over 28.3% of the total supply.
- Accumulation addresses, which have no selling history, hold an all-time high of 22.8 million ETH.
- Potential Fibonacci targets in a bullish scenario include $5,817 and $8,549.
If ETH fails to break above the 50-week EMA ($2,650–$2,700), a retest of lower trendline support near $2,000–$2,050 may occur, coinciding with the 0.786 Fibonacci level.