Feb 10, 2026
4 0
BULLISH 📈 : Ethereum targets breakout above $2,150 resistance level
Ethereum Price Analysis
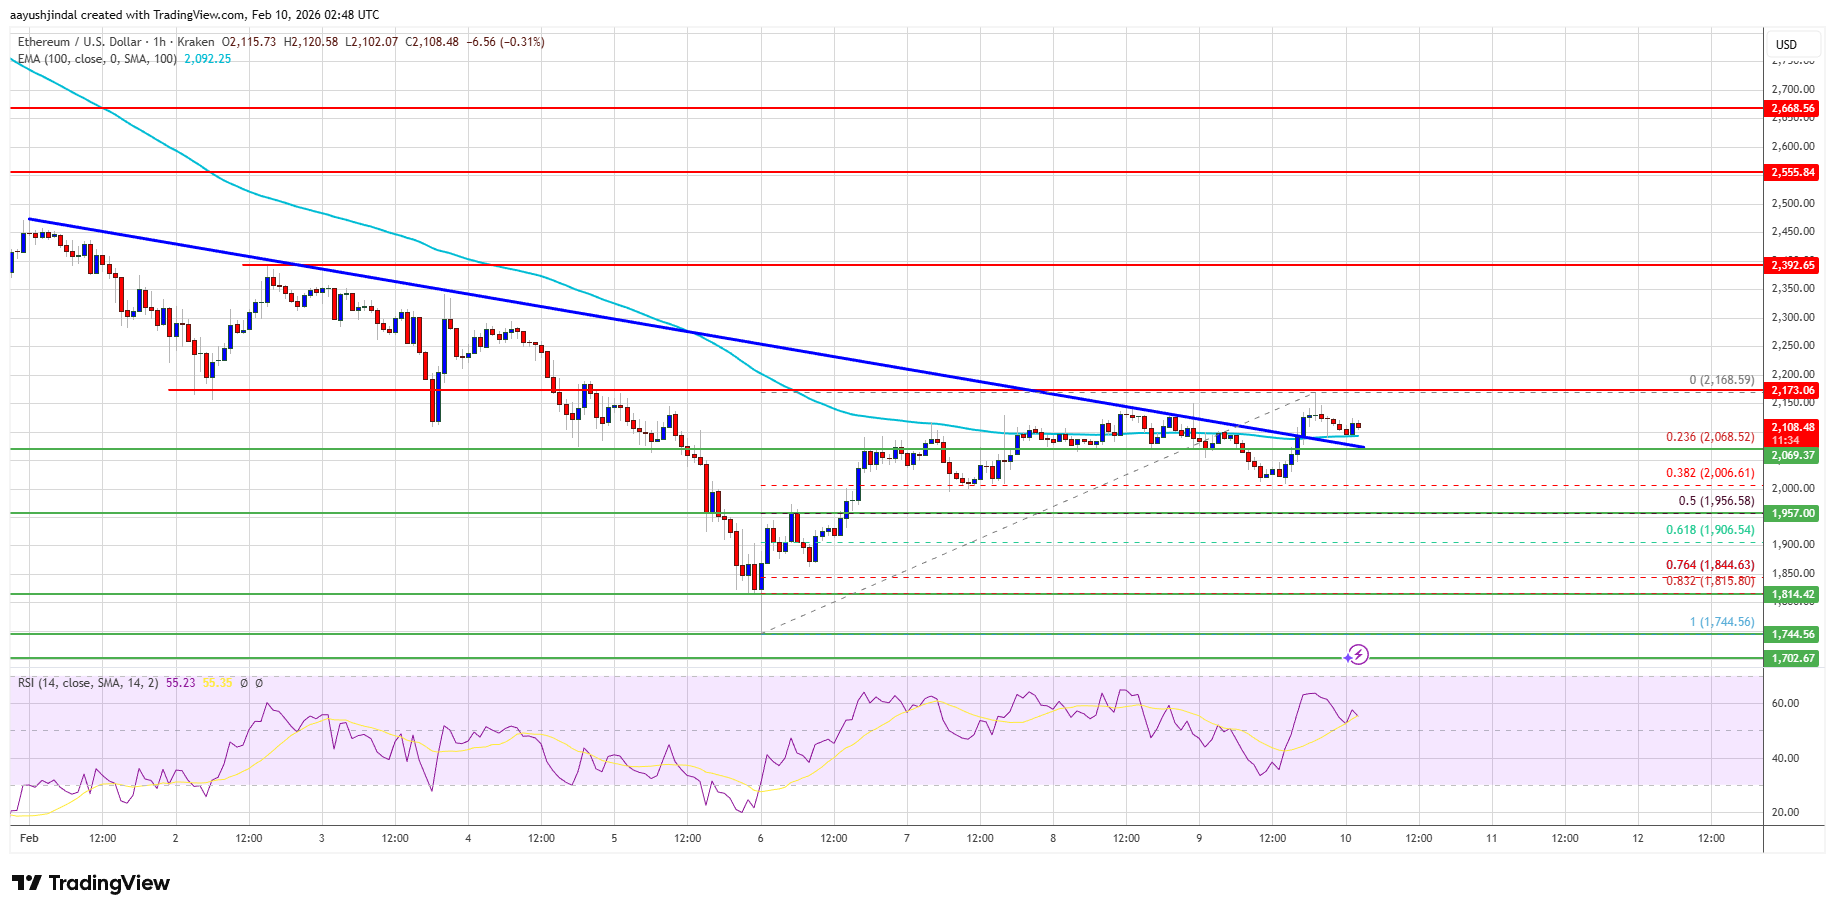
- Ethereum formed a base above $1,950 and initiated a recovery wave.
- The price is currently trading above $2,020 and the 100-hourly Simple Moving Average.
- A break occurred above a major bearish trend line at $2,070 on the hourly ETH/USD chart.
- The price reached a high of $2,168 and is consolidating gains above the 23.6% Fibonacci retracement level from $1,744 to $2,168.
Potential Upside for Ethereum
- If Ethereum maintains above $2,020, it could attempt another increase.
- Immediate resistance is near $2,150; key resistances are at $2,165 and $2,250.
- A clear move above $2,250 might drive the price toward $2,350, with potential further gains to $2,550 or $2,665.
Risk of Decline
- If Ethereum fails to surpass the $2,150 resistance, a decline may occur.
- Initial support is around $2,050, with major support near $2,020.
- A drop below $2,020 could push the price toward $1,950 or $1,845, with main support at $1,800.
Technical Indicators
- Hourly MACD: Losing momentum in the bearish zone.
- Hourly RSI: Above the 50 zone.
- Major Support Level: $2,020
- Major Resistance Level: $2,165