Jan 10, 2026
0 0
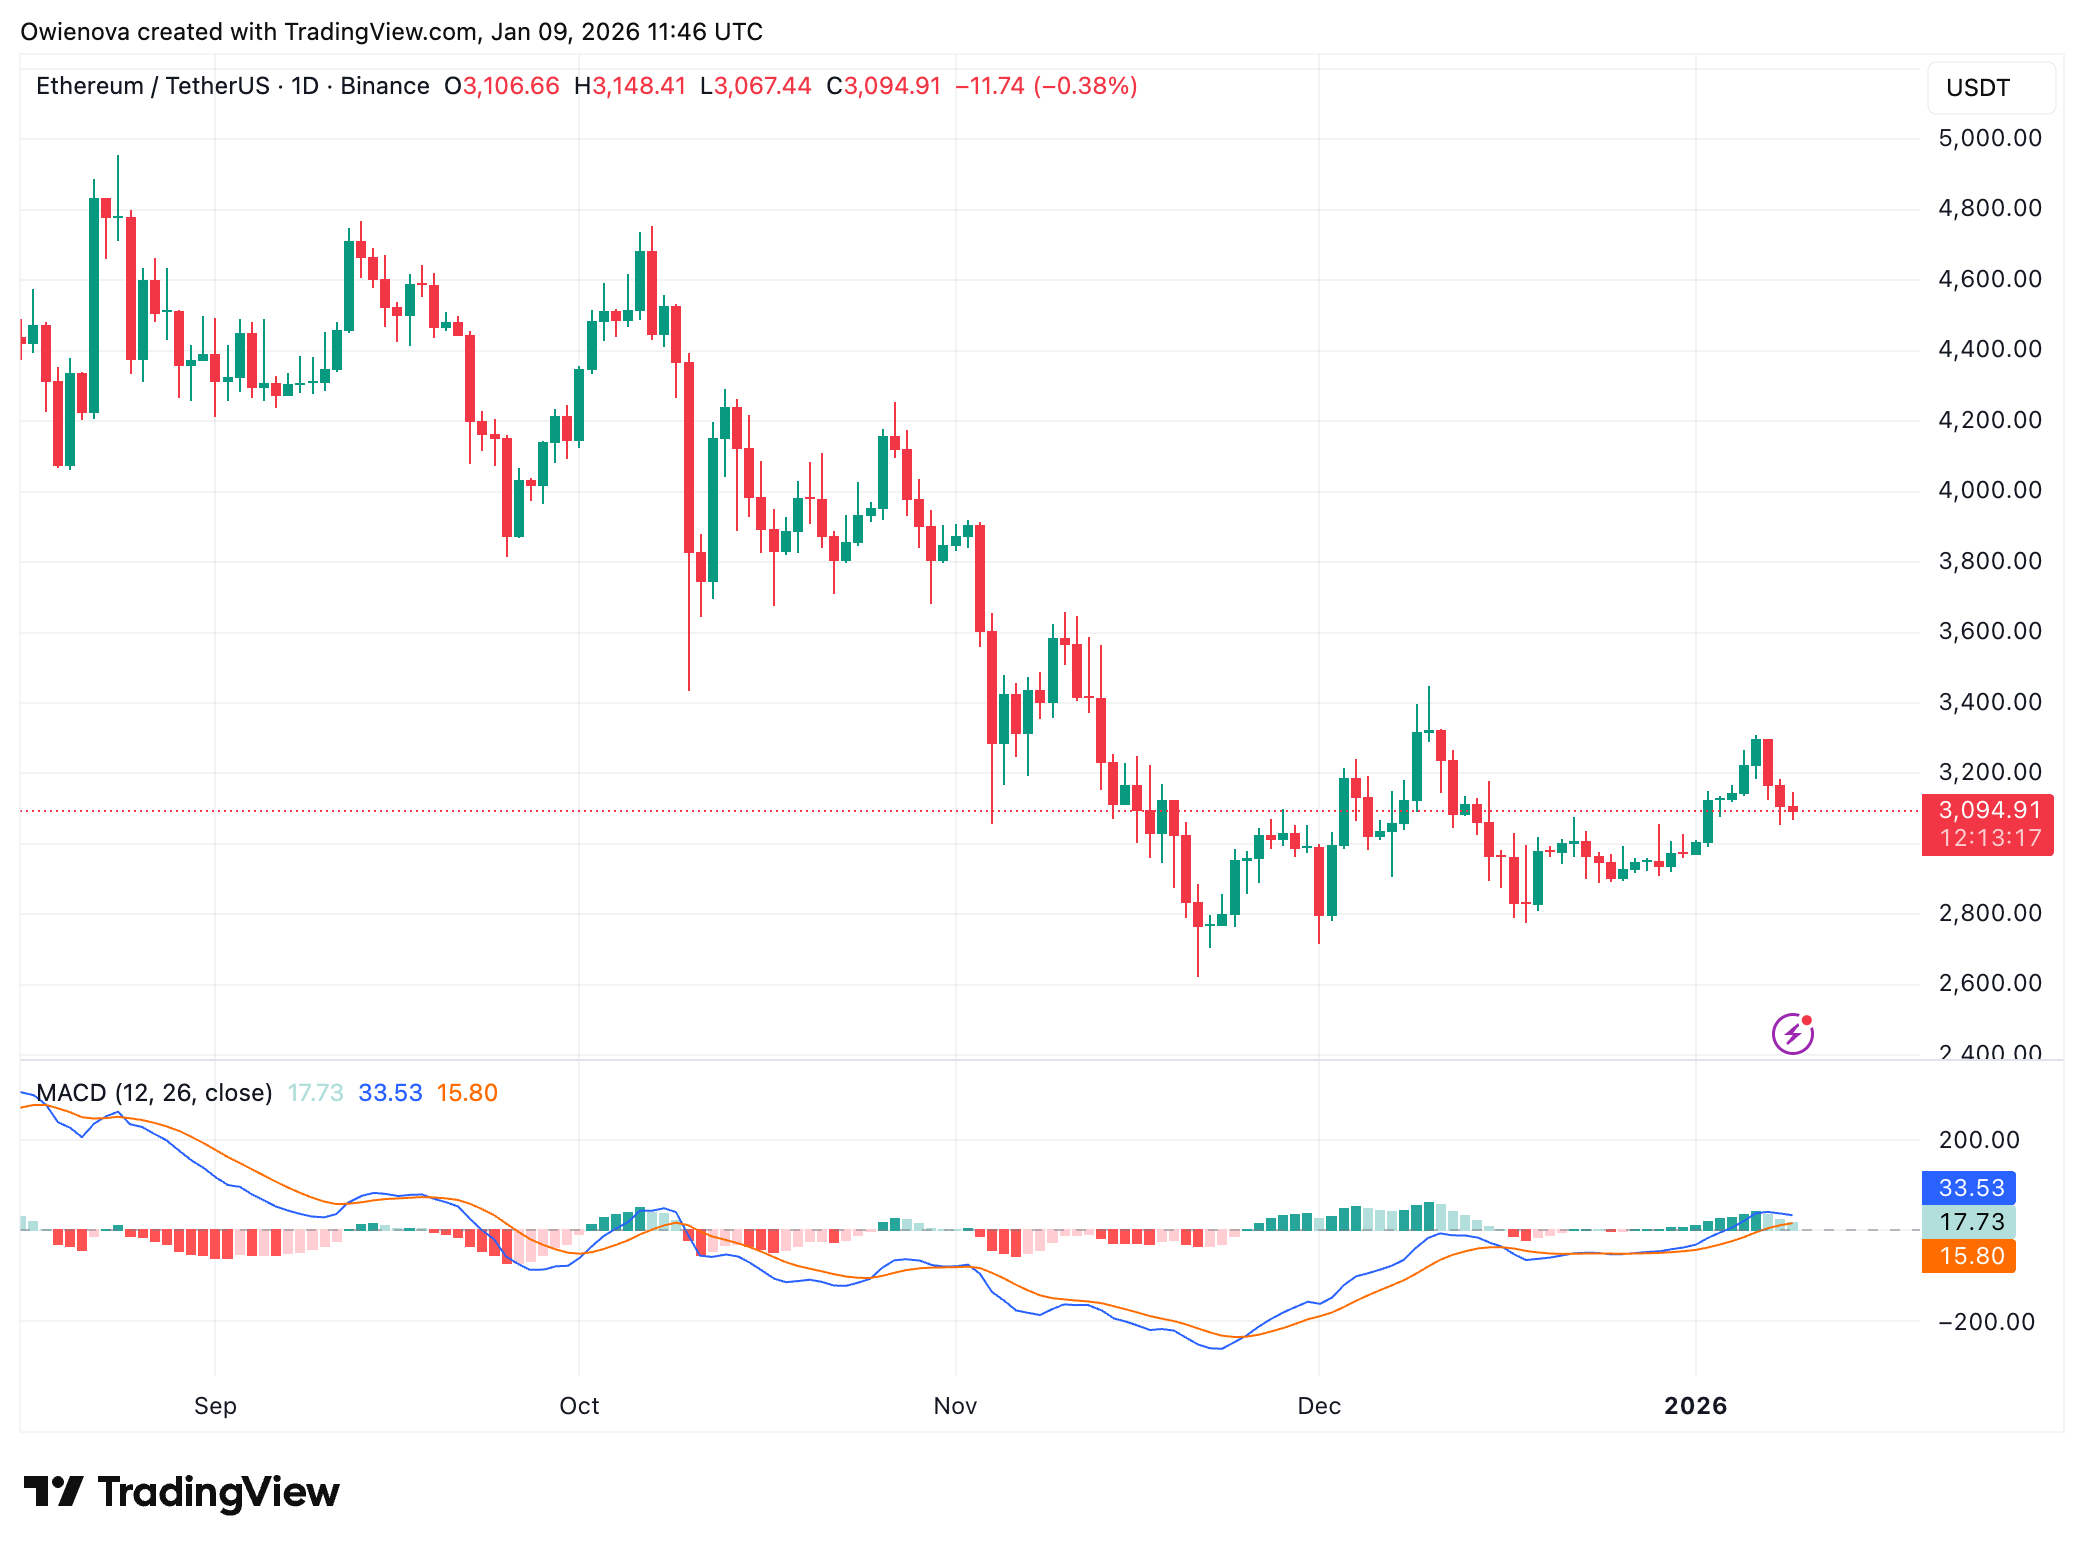
Ethereum Approaches Breakout as Accumulation Nears Completion
Ethereum is in a prolonged accumulation phase, suggesting a potential pivotal market transition. The ETH/BTC pair is defending long-term cycle support, indicating underlying strength and a possible decisive move.
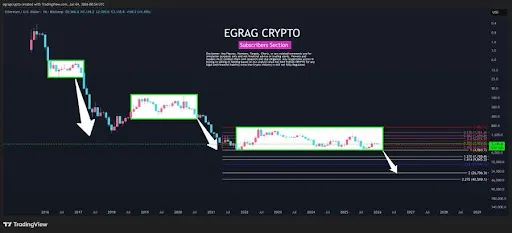
Key Insights from Ethereum's Inverted Monthly Chart
- The inverted chart reflects a familiar cyclical pattern with evolving characteristics.
- Volatility is compressing, leading to more controlled price behavior.
- Current accumulation is longer than previous cycles, suggesting a shallow corrective phase.
- Initial resistance expected between $3,800 and $4,500; successful support flip could target $6,000 to $7,500.
- Risk of deeper retest toward $1,800 to $2,200 remains before broader upside continuation.
ETH/BTC as a Market Indicator
- ETH/BTC chart is crucial for monitoring, defending the 2018 cycle support.
- Price action shows higher lows with tightening below key resistance levels, hinting at a larger move.
- No panic or structural damage evident; sellers unable to force a breakdown.
- Holding relative value signals early capital rotation stages.
- Sustained stability on the ETH/BTC pair often precedes Ethereum's lead once momentum returns.