Feb 20, 2026
2 0
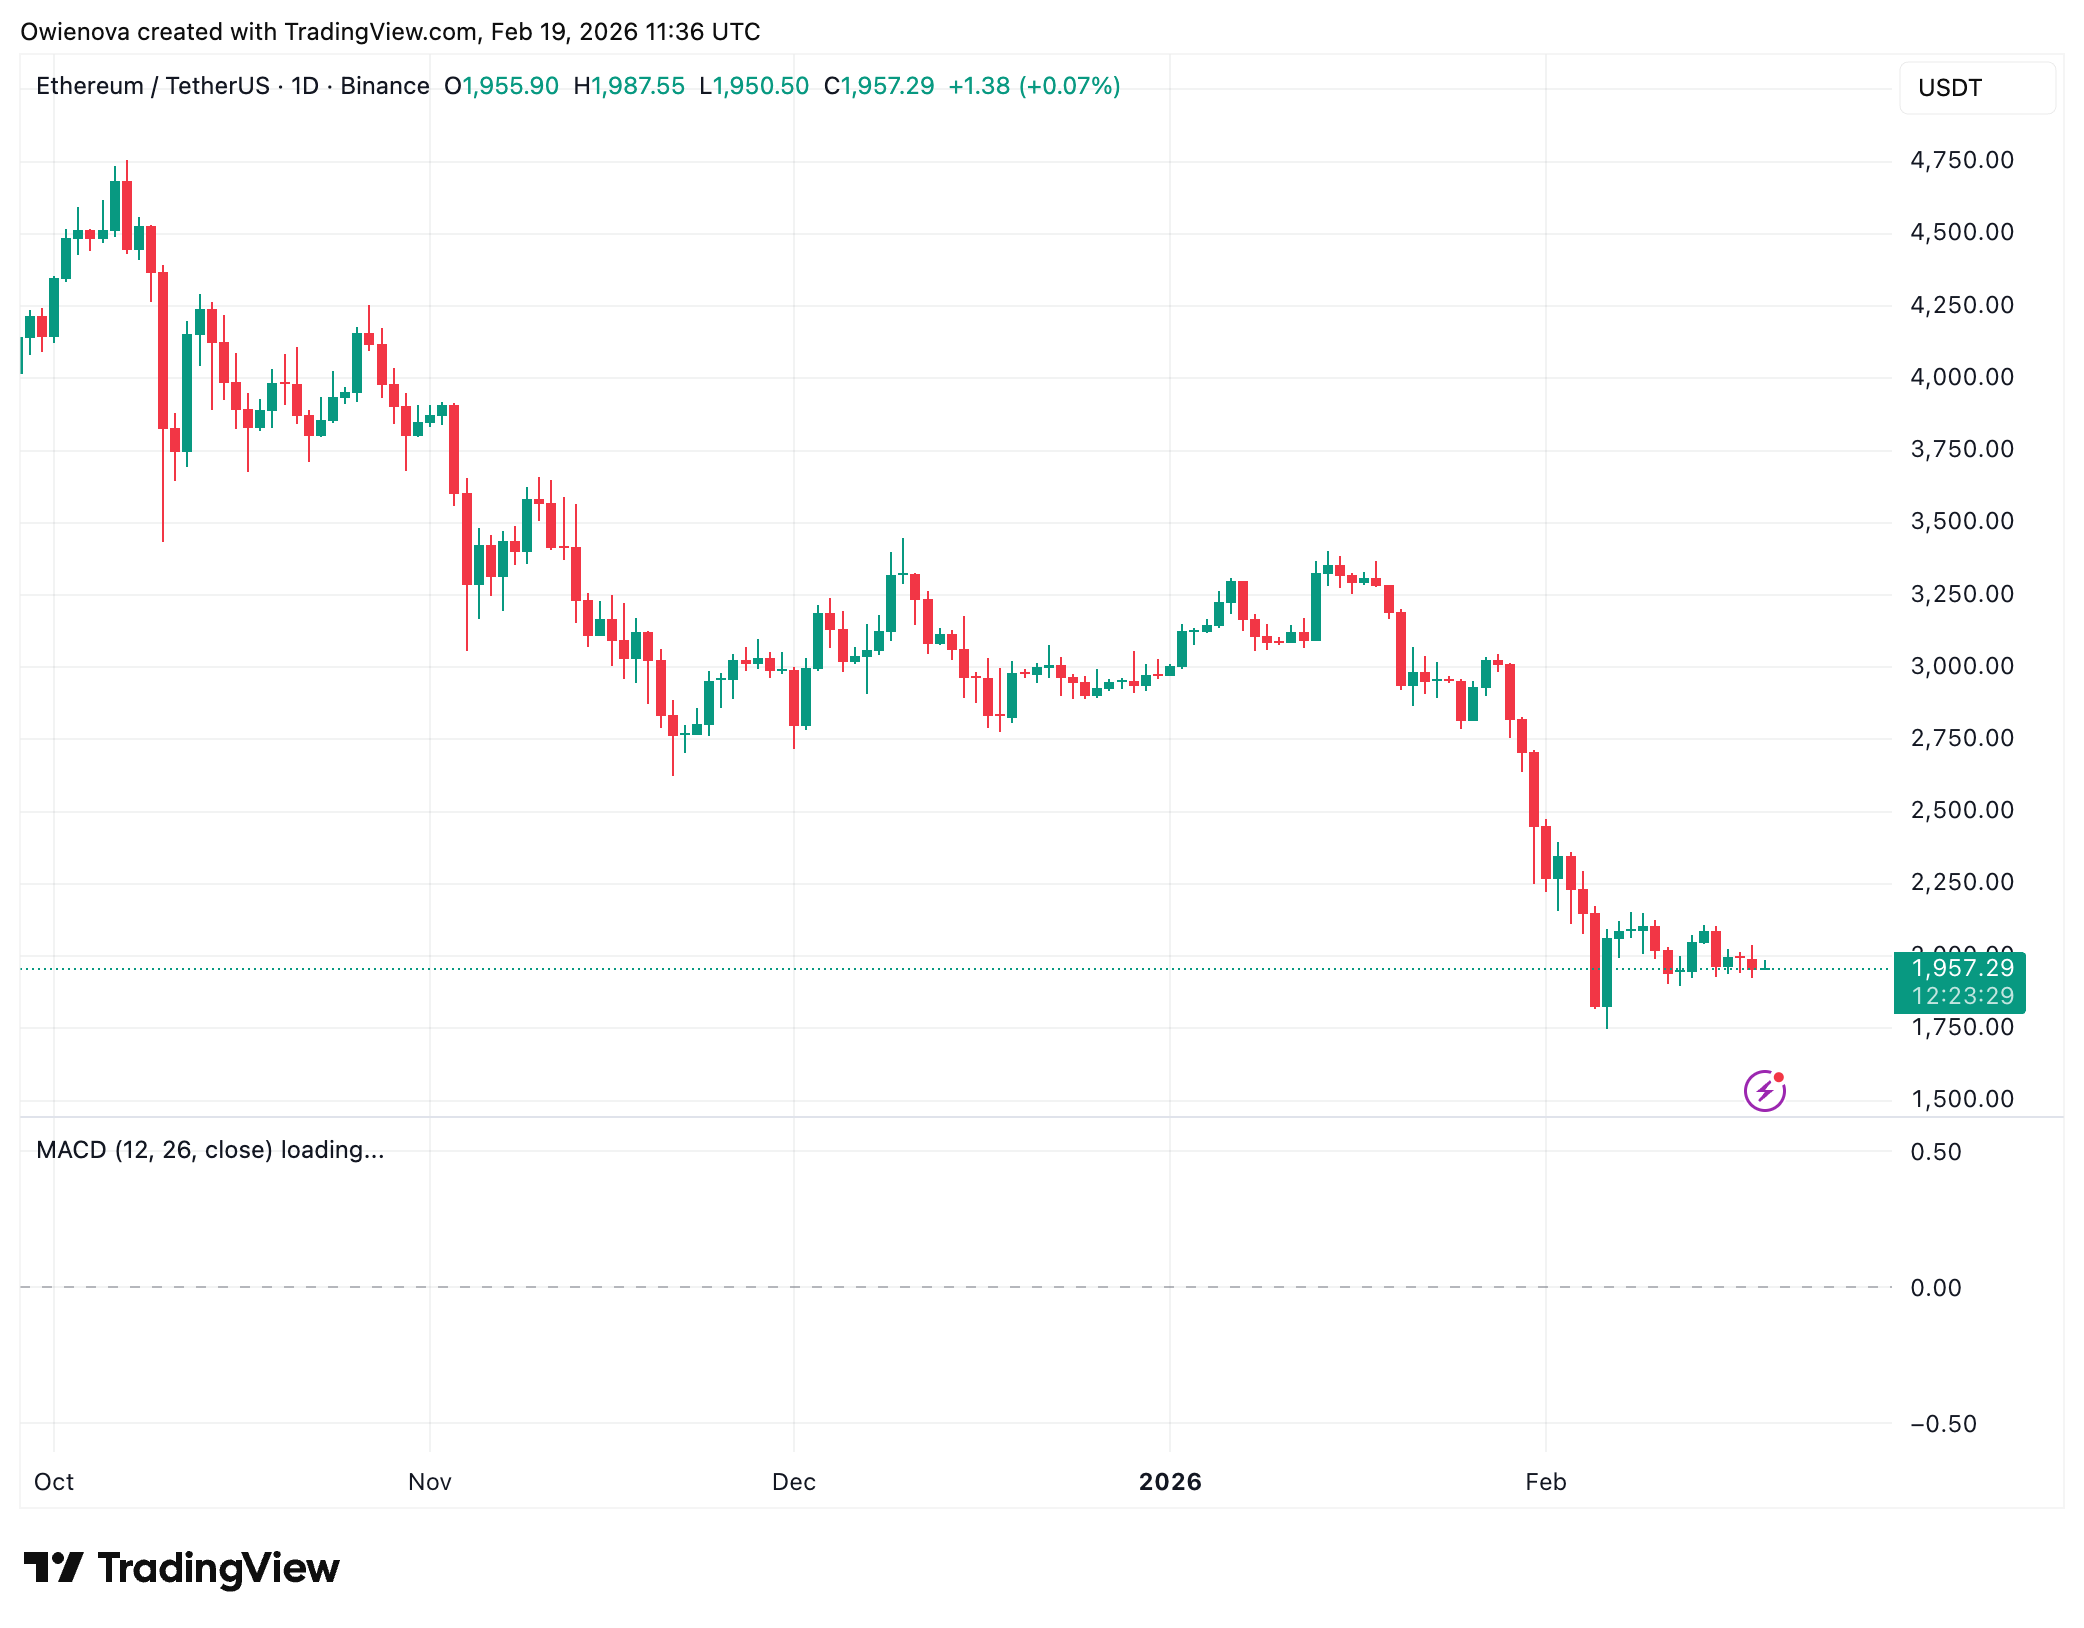
BEARISH 📉 : Ethereum falls below $2,100 support, signals bearish momentum
Ethereum's price has experienced a significant decline, falling below the critical $2,100 level, indicating short-term bearish pressure. Despite this, a repeating fractal pattern on higher timeframes suggests potential for a future breakout.
Key Support Zone Breached
- Ethereum lost its key daily support zone between $2,300 and $2,100.
- This area previously absorbed selling pressure, marking a technical shift as it turns into resistance.
- ETH attempts to reclaim this range have been unsuccessful, indicating strong seller defense.
- The next major support lies between $1,700 and $1,500 if bearish momentum continues.
- A sustained move above $2,300–$2,100 is needed to invalidate the downside scenario.
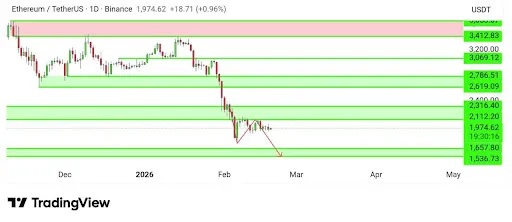
Fractal Pattern Suggests Possible Rally
- Analysis points to a fractal pattern similar to one before Ethereum's 2025 rally.
- A rectangular consolidation box is forming within an ascending channel.
- This setup resembles prior price behavior before a substantial upside move.
- If the pattern holds, a breakout above the current range could trigger a strong upward expansion.
- A confirmed break above the range would indicate a transition from accumulation to markup.