Ethereum Price Could Reach $12,000 Amid Inverse Head and Shoulders Pattern
The Ethereum price is showing potential for a breakout, as an analyst has identified the formation of an inverse head and shoulder pattern on its 6-month price chart. This bullish formation supports predictions that Ethereum could reach $12,000 soon, marking a new all-time high for the second-largest cryptocurrency by market capitalization.
Ethereum Price Targets $12,000 with New Chart Pattern
Crypto analyst Tony Severino shared an Ethereum price chart on X (formerly Twitter), illustrating an inverse head and shoulder pattern, which signals a potential trend reversal. The pattern consists of four components: left shoulder, head, right shoulder, and neckline.
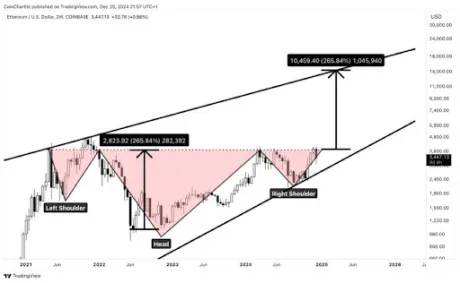
A completed inverse head and shoulder pattern indicates a potential shift from a downtrend to an uptrend. Ethereum's price has recently declined over 8% in the past week, dropping from a high of over $4,000 to below $3,500. Despite this, Severino predicts a bullish price target of $12,000 for Ethereum.
The left shoulder formed in 2021, while the head occurred during Ethereum’s price crash at the end of 2022. The right shoulder is now complete, with Ethereum testing the neckline — a key resistance level. Recently, Ethereum broke above $3,400, confirming the bullish trend reversal associated with this chart pattern.
The distance between the head and the neckline measures approximately 265.84%, suggesting that Ethereum could rally between $10,000 and $12,000 if the pattern plays out. The upward-sloping channel of the inverse head and shoulder further supports this outlook, aligning with Severino’s price target.
Ethereum Whale Accumulation Trend Increases
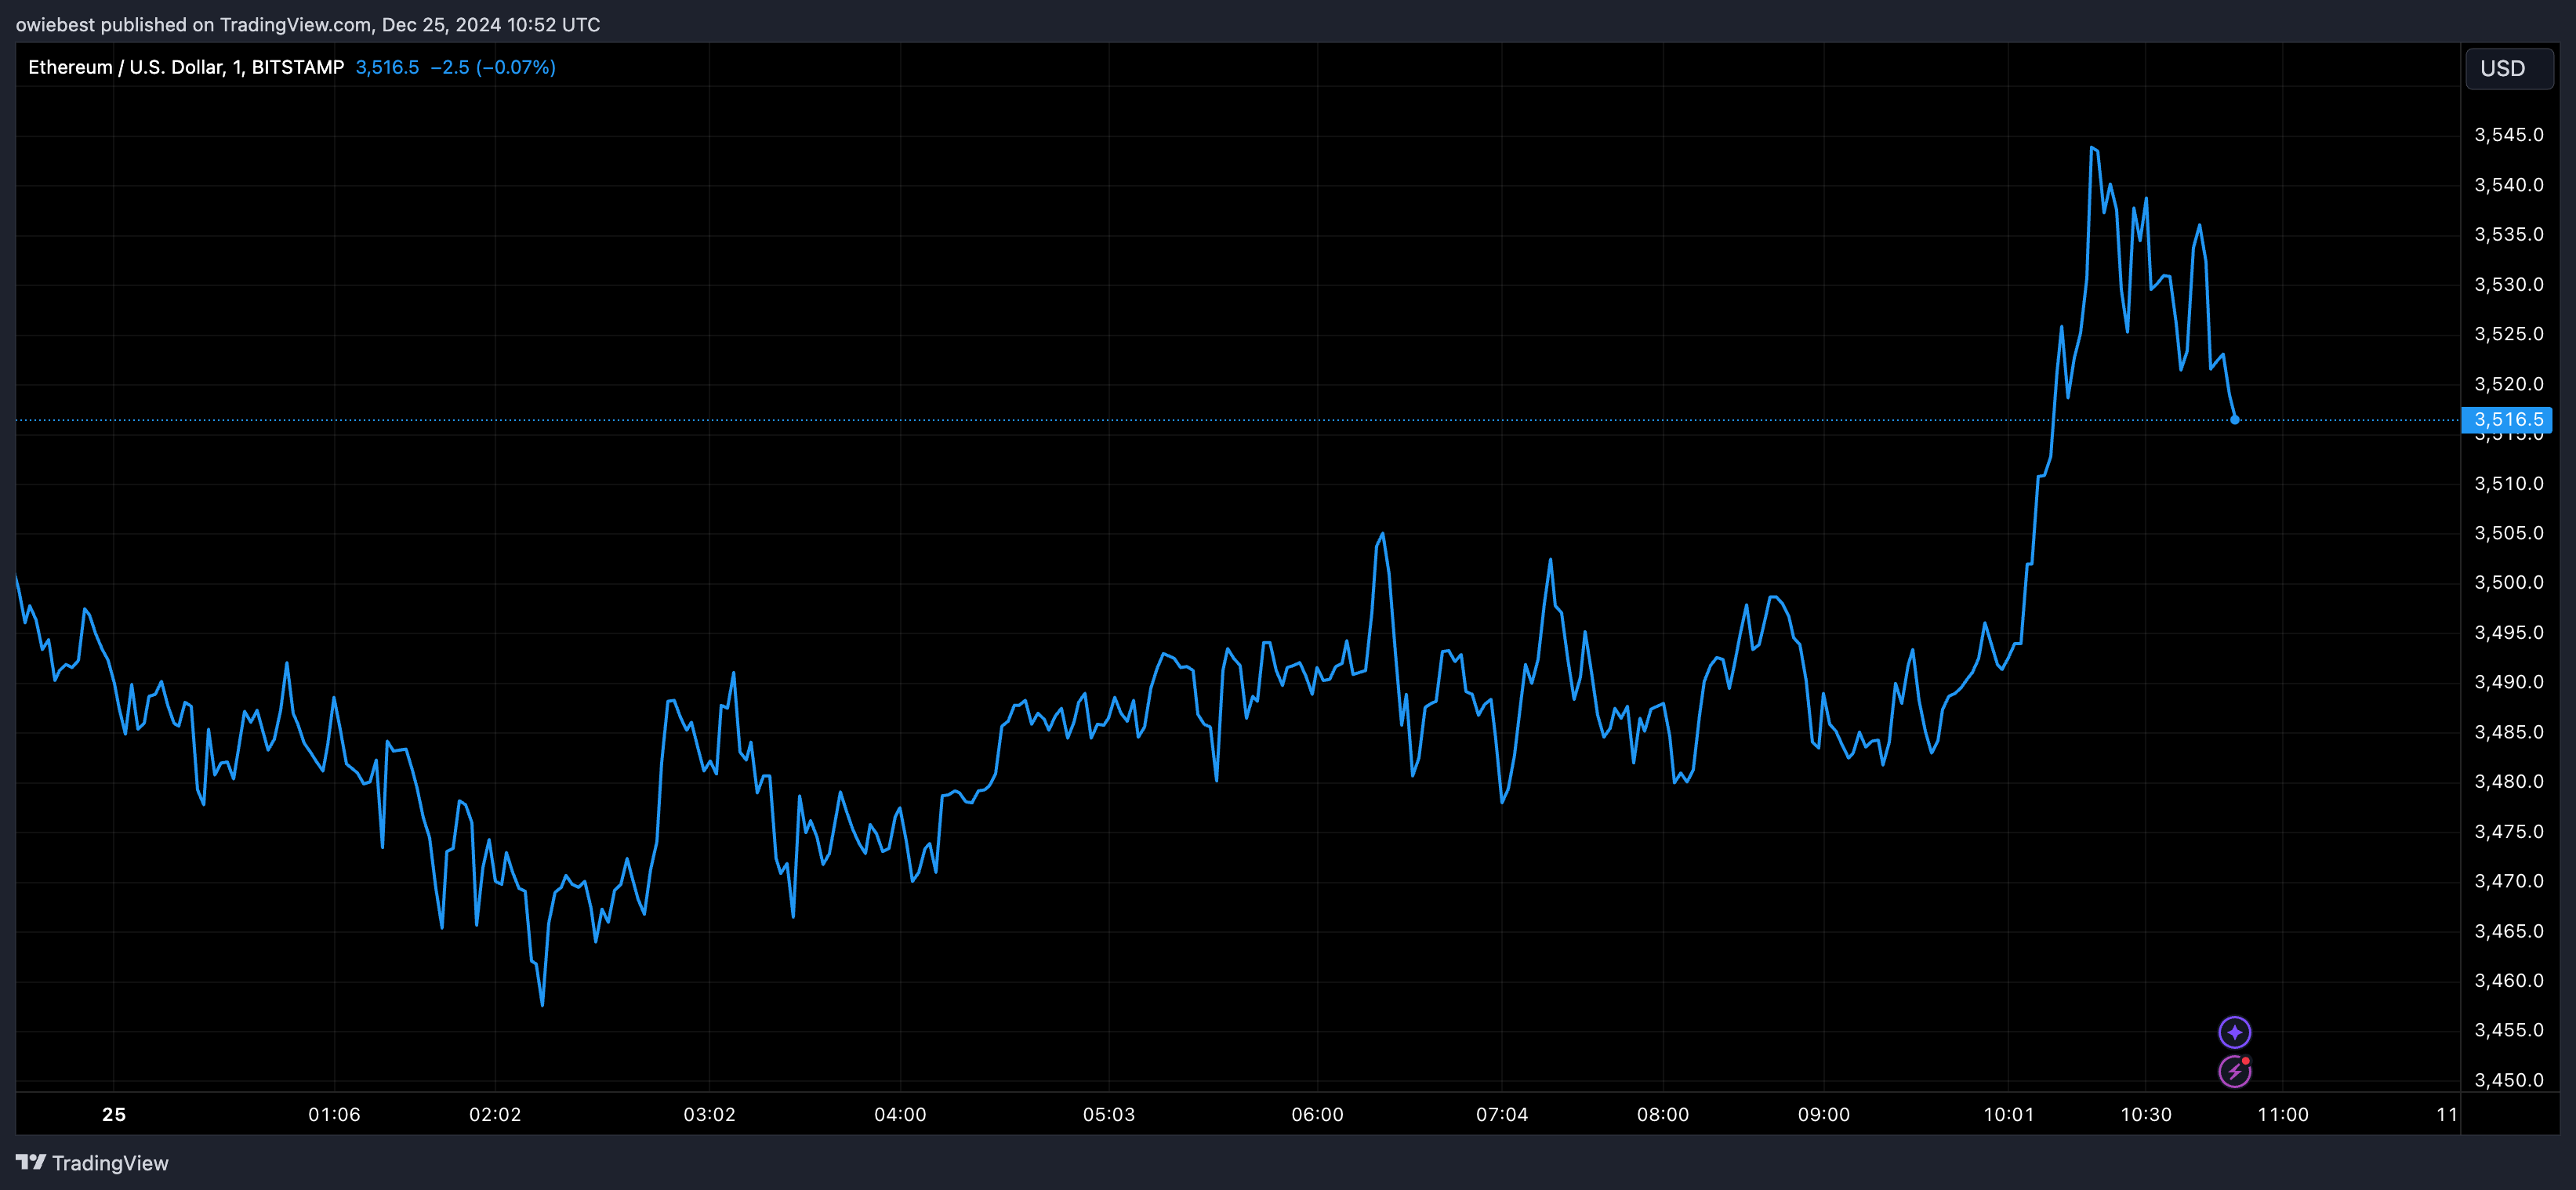
The current Ethereum price is $3,493 after a 2.3% increase in the past 24 hours. Analyst ‘Mister Crypto’ noted significant whale activity, indicating that whales have been accumulating ETH tokens rapidly.
Mister Crypto shared a chart showing Ethereum's balance on accumulation addresses, revealing that whales have been purchasing ETH exponentially since 2017. The rise in accumulation suggests investors may be positioning themselves ahead of bullish price action.
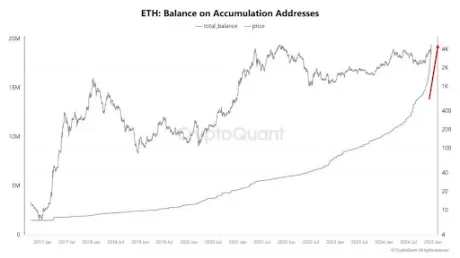
The red arrow in the chart indicates a spike in ETH balance on accumulation addresses in recent months, with most wallets seeing minor outflows, signaling long-term holding behavior among investors.