Oct 21, 2025
6 0
Ethereum Price Declines Below $4,000 After Recent Recovery Wave
Ethereum Price Analysis
- Ethereum began a recovery above $3,880 and $3,980 but couldn't sustain above $4,050.
- The price is currently below $3,950 and the 100-hourly SMA.
- A break occurred below a bullish trend line at $3,960 on the ETH/USD hourly chart.
- Potential further decline if trading continues below $3,840.
Ethereum saw a temporary rise past key levels ($3,880 and $3,980), entering a short-term positive zone. However, resistance around $4,080 halted further gains. The price didn't stabilize above the 61.8% Fib retracement from $4,292 to $3,677, leading to a drop below $4,000.
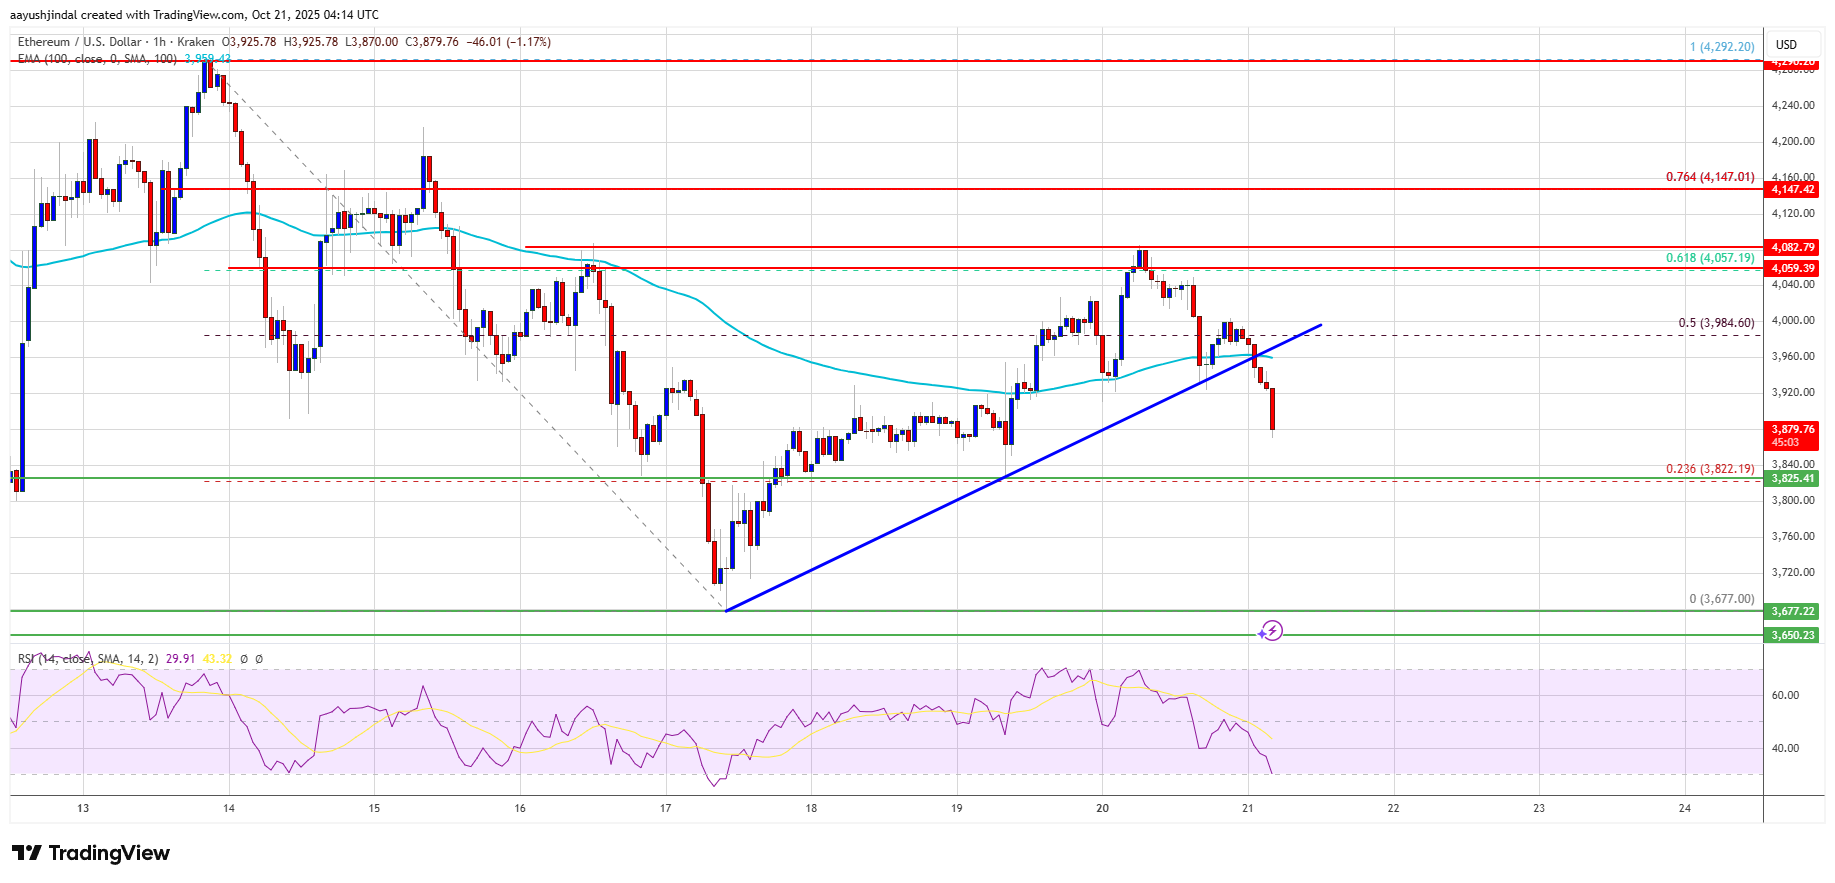
Resistance Levels
- $3,980 - Initial resistance
- $4,050 - Next key resistance
- $4,080 - Major resistance
A breakout above $4,080 could push Ethereum towards $4,120, potentially reaching $4,220 or $4,250 soon.
Support Levels & Downside Risks
- $3,860 - Initial support
- $3,840 - First major support
- $3,820 - Potential support if declines continue
- $3,680 - Further downside target
- $3,620 - Key support level
Technical indicators suggest bearish momentum:
- Hourly MACD: Gaining in the bearish zone
- Hourly RSI: Below 50
In summary, Ethereum faces resistance near $4,050 and risks further decline if it falls below $3,840.