Ethereum Price Tests $2,380 Support Amid Struggles to Break $2,520
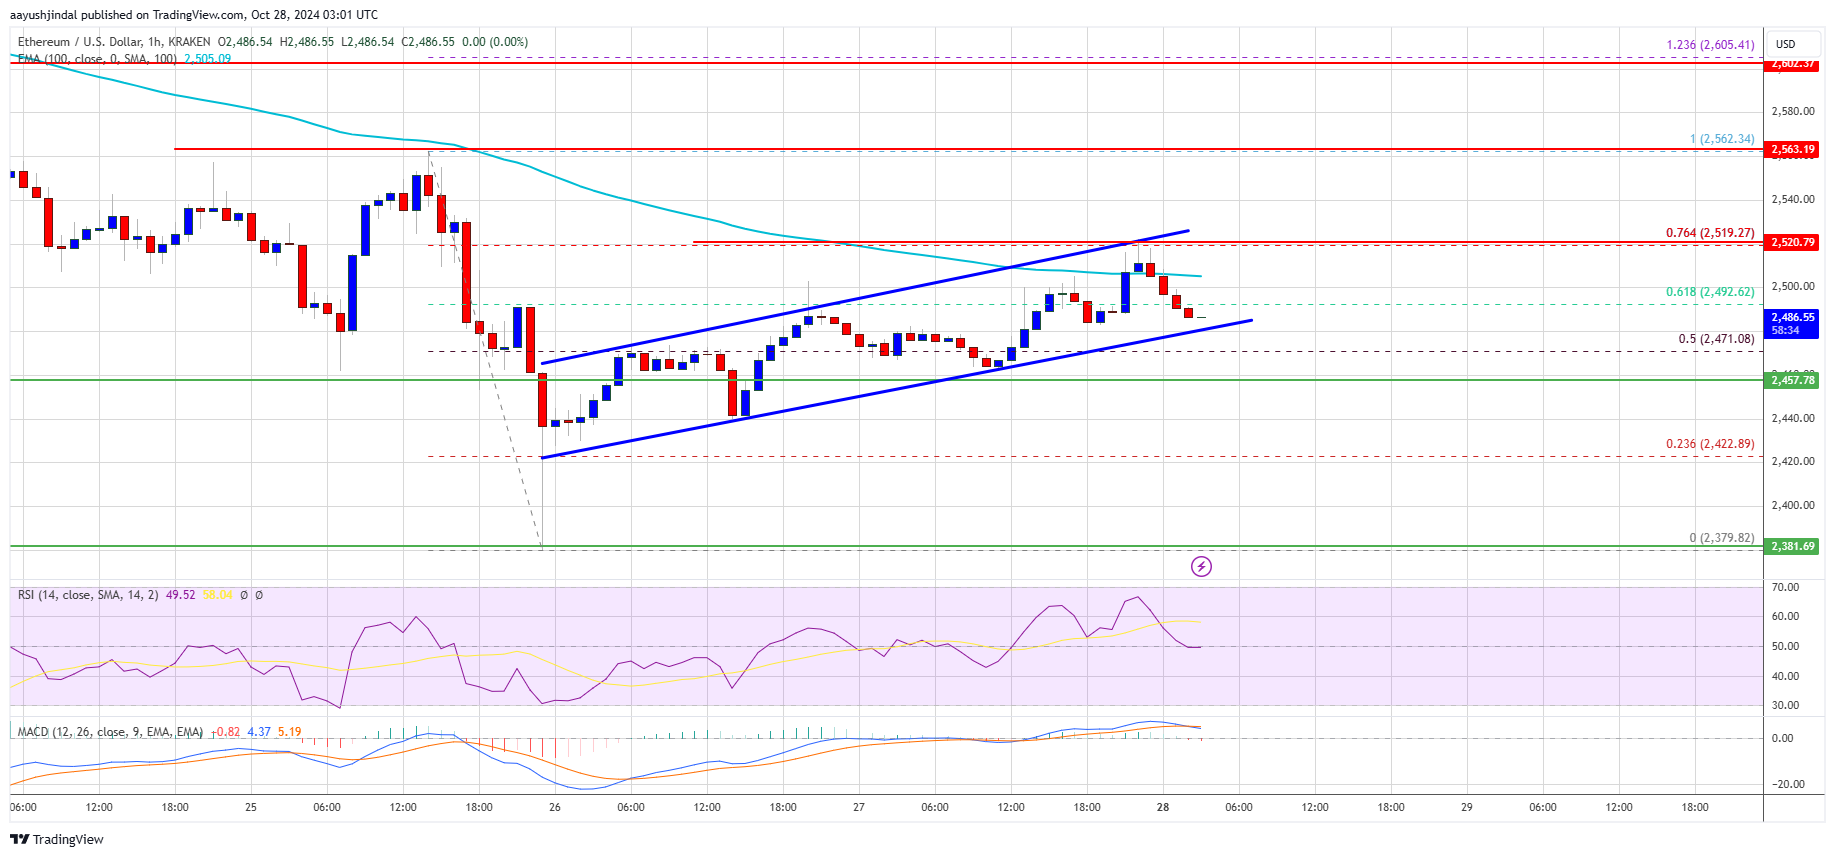
Ethereum price tested the $2,380 support zone and is currently recovering but struggling to surpass the $2,520 level.
- Ethereum initiated a recovery from the $2,380 zone.
- The price remains below $2,500 and the 100-hourly Simple Moving Average.
- A short-term rising channel is forming with support at $2,480 on the hourly chart of ETH/USD (data feed via Kraken).
- The pair may begin a fresh increase if it breaks through the $2,520 and $2,550 resistance levels.
Ethereum Price Aims Higher
Ethereum's price fell below the $2,250 level, trading as low as $2,379 before starting an upward correction. The price increased above $2,420 and surpassed the 50% Fib retracement level of the decline from the $2,562 swing high to $2,379 low. Though it broke above the $2,500 resistance, it encountered difficulties near $2,520.
The current trading status is below $2,500 and the 100-hourly Simple Moving Average. A short-term rising channel is present, with support at $2,480. The price faces challenges near $2,520 and the 100-hourly Simple Moving Average, close to the 76.4% Fib retracement level of the downward movement.
Major resistance is identified at $2,550, with a significant resistance area forming near $2,600. A clear move above this level could lead the price towards $2,650, and breaking that could result in further gains, potentially targeting the $2,750 resistance zone.
Another Decline In ETH?
If Ethereum does not overcome the $2,520 resistance, it may face another decline. Initial support is around $2,480, with the first major support near $2,420. A drop below $2,420 could push the price toward $2,380, with further losses possibly reaching the $2,320 support level and a key support at $2,250.
Technical Indicators:
Hourly MACD: The MACD for ETH/USD is losing momentum in the bullish zone.
Hourly RSI: The RSI for ETH/USD is near the 50 zone.
Major Support Level: $2,450
Major Resistance Level: $2,520
