Feb 3, 2026
3 0
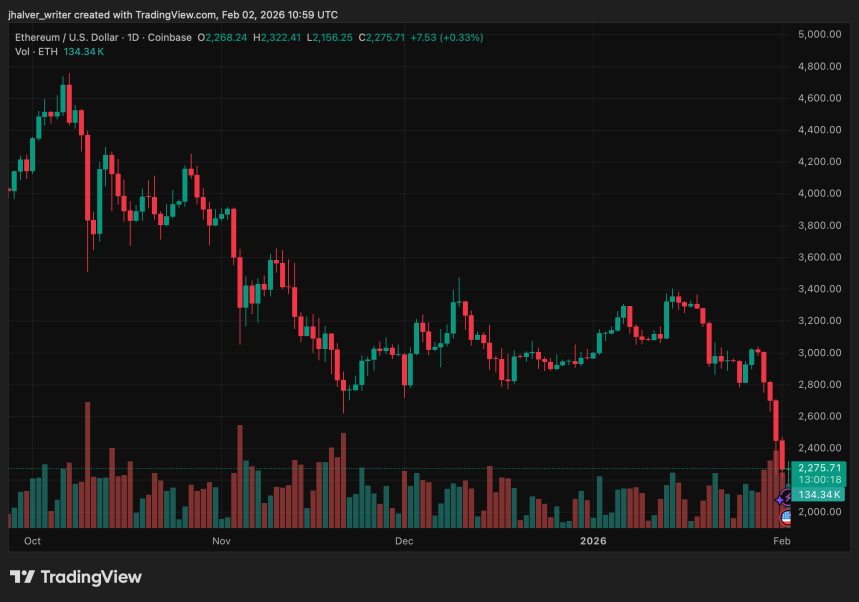
BEARISH 📉 : Ethereum price weakens, $2,200 support zone under pressure
Ethereum (ETH) recently experienced a sharp decline, erasing recent gains and approaching the critical $2,200 level after failing to surpass the $2,500–$2,550 resistance zone.
Key Points
- ETH has dropped over 20% from recent highs, briefly falling below $2,220 before stabilizing.
- The price is now below the $2,300–$2,400 range and crucial short-term moving averages.
- A potential bearish trend line around $2,400–$2,420 could mitigate downside pressure if reclaimed.
- The $2,200 mark serves as key support, with risks of further declines to $2,050 or $2,000 if breached.
- Momentum indicators remain negative, with the hourly RSI below 50 and MACD showing bearish trends.
Market Dynamics
- Exchange inflows surged, with around 600,000 ETH transferred to major exchanges in one day, indicating potential selling or risk reduction.
- ETH-related liquidations reached approximately $280 million in 24 hours, suggesting heavy stress in derivatives markets.
- This rapid unwinding reveals structural weaknesses, as spot demand failed to counter forced selling pressures.
Whale Activity
- Dormant wallets reactivated after five years, posting over 45,000 ETH as collateral for a substantial long position.
- This activity indicates mixed sentiment, with some large holders increasing exposure while others deleverage.
The clash between whale longs and bearish exchange flows creates uncertainty at the $2,200 level. A rebound above $2,420 could shift momentum towards buyers, whereas a failure to maintain support might confirm ongoing distribution pressure.