Tools and Indicators Used to Predict Crypto Market Cycle Peaks
Predicting the top of a crypto market cycle involves both analytical tools and historical data. Here are five key indicators used by investors:
Bitcoin Halving
The Bitcoin halving occurs approximately every four years, reducing the block reward from 6.25 to 3.125 BTC in the latest event. This event is significant as it often signals the start of speculation in crypto markets, with cycles typically peaking 12-18 months post-halving.
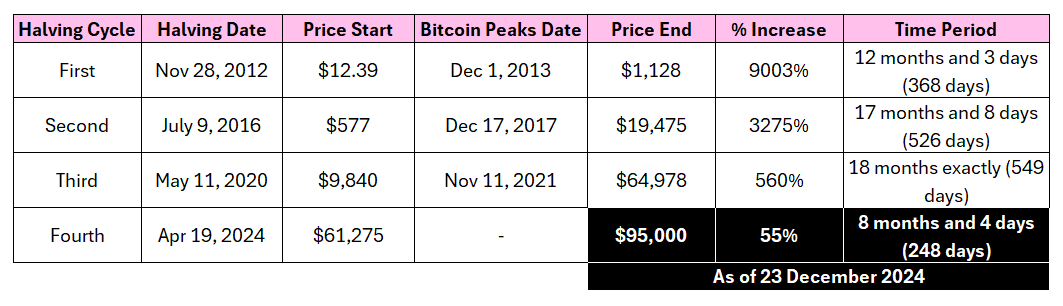
Currently, we are eight months into the latest halving in April 2024, suggesting further developments in this cycle.
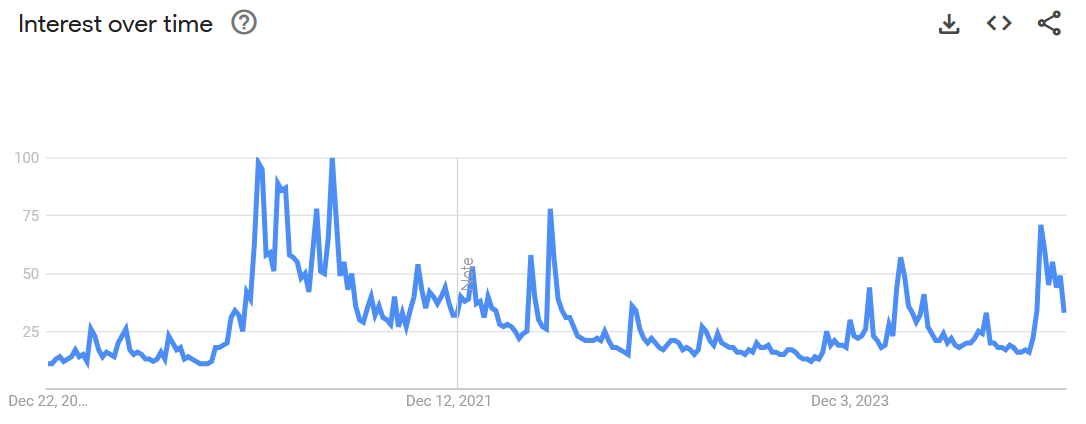
Google Search for ‘Bitcoin’
The volume of Google searches for “bitcoin” serves as a straightforward indicator of retail interest. Historical data shows that peak search interest often precedes price peaks by several months.
Pi Cycle Top Indicator
The Pi Cycle Top uses two moving averages (111-day and 350-day) to indicate potential market tops. Historical accuracy has been noted in prior bull cycles, with market tops observed when the shorter average crosses above the longer one.
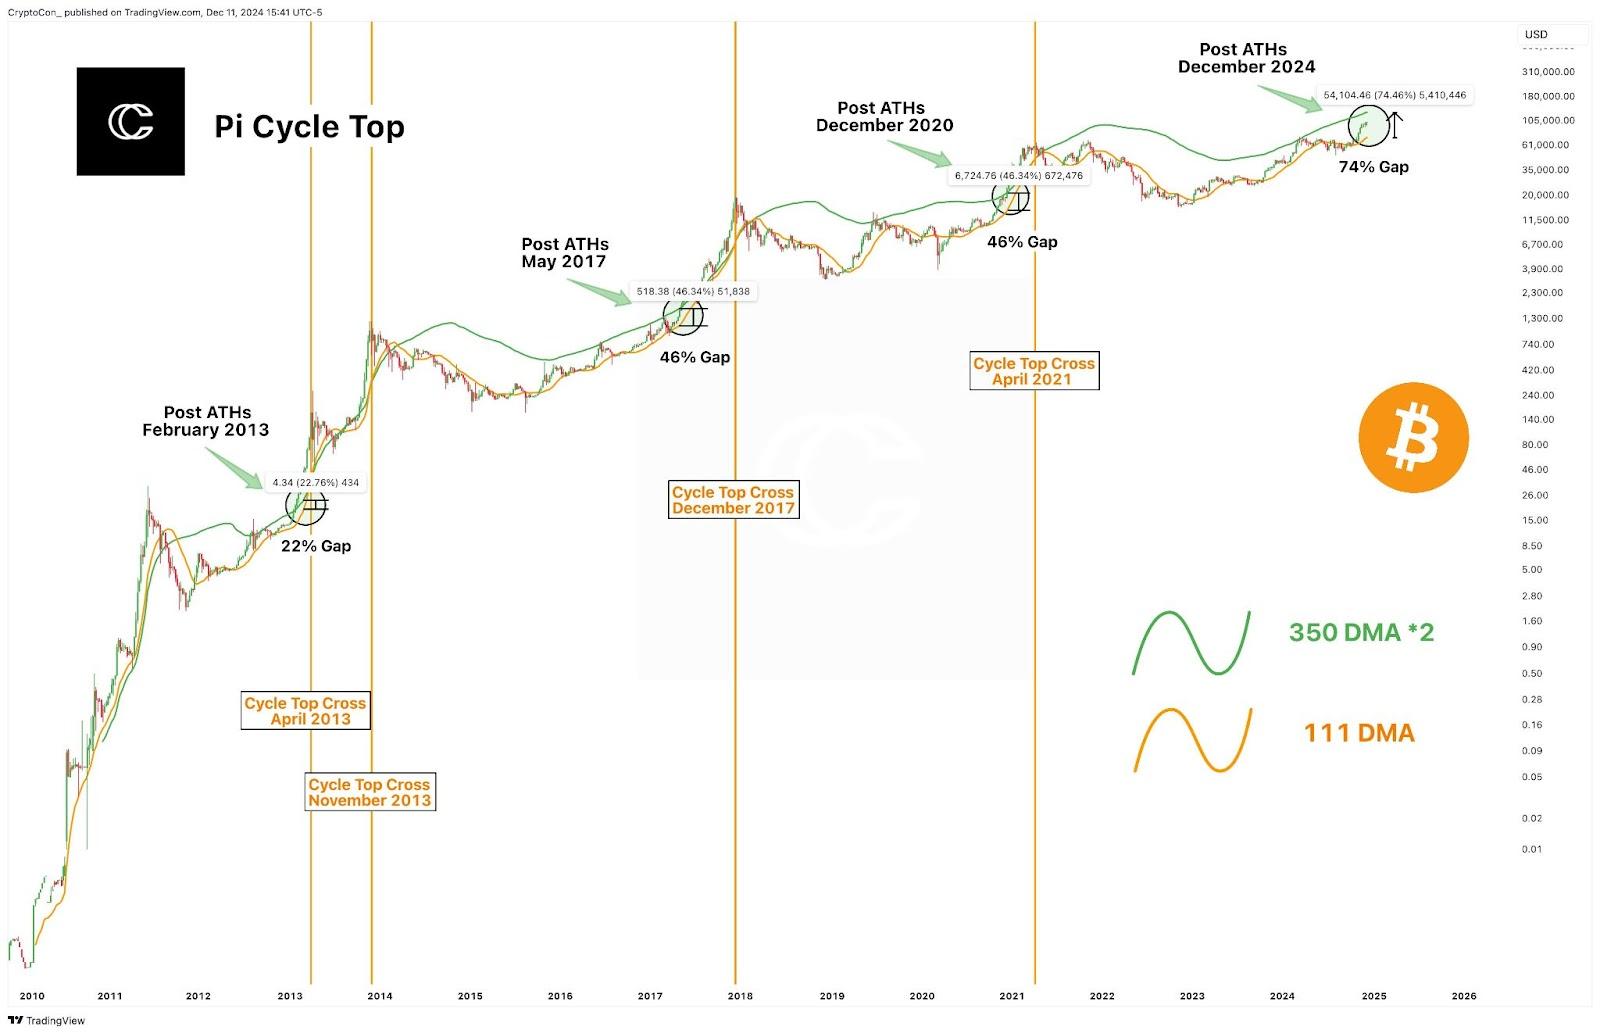
This indicator suggests market euphoria drives prices beyond sustainable levels, indicating an impending market correction.
App Store Rankings
High rankings for Coinbase on app stores indicate increased activity among new investors, suggesting a nearing market top. Recent rankings have fluctuated between 66th and 135th.
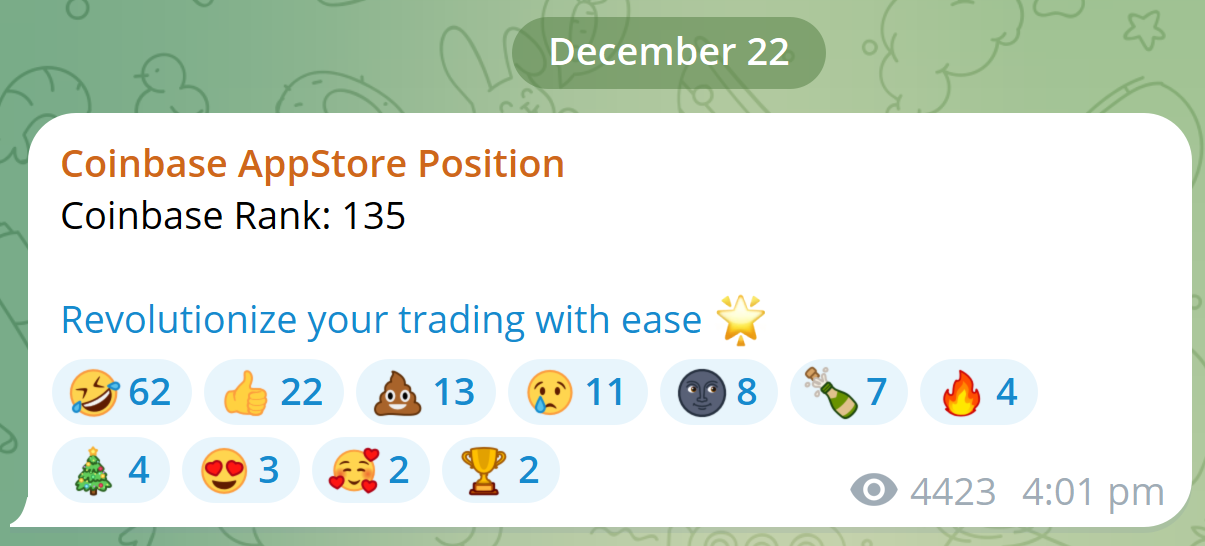
Additionally, Phantom Wallet rankings reflect interest in Solana memecoins, indicating retail investor behavior.
ETH:BTC Ratio
The ETH:BTC ratio tracks investor behavior, where initial investments in bitcoin transition to riskier altcoins over time. A rising ratio signals increased speculation in altcoins.
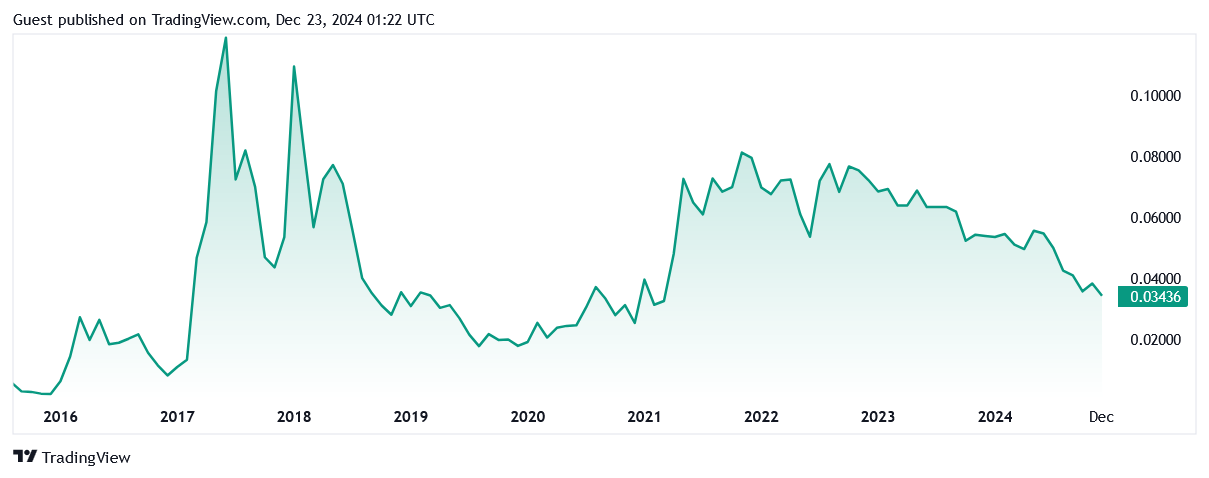
Currently, the ratio stands at 0.034, significantly lower than its past peaks, indicating potential market vulnerabilities.