Jan 11, 2026
0 0
Inverted Ethereum Chart Signals Imminent Breakout to New Price Highs
Ethereum has been experiencing prolonged sideways price movement, testing the patience of investors. Despite this, a new all-time high was reached in 2025.
Technical Analysis Insights
- A technical analysis using an inverted monthly chart shows Ethereum's current pattern aligns with historical cycles.
- Previous cycles featured short accumulation phases followed by aggressive moves; recent cycles show longer accumulation and more controlled movements.
- The current cycle is characterized by an extended accumulation period, suggesting a shorter eventual drop.
Implications for Future Price Movement
- An inverted chart indicates that what appears as a downside actually points to potential upside on the real chart.
- A breakout from the current range is expected to be orderly and sustained, potentially taking Ethereum to new highs.
- Key resistance levels are identified between $3,800 to $4,500, with further targets at $6,000 to $7,500 upon successful clearance.
- A pullback to $1,800 to $2,200 could delay the breakout but would not invalidate the bullish thesis if broader consolidation holds.
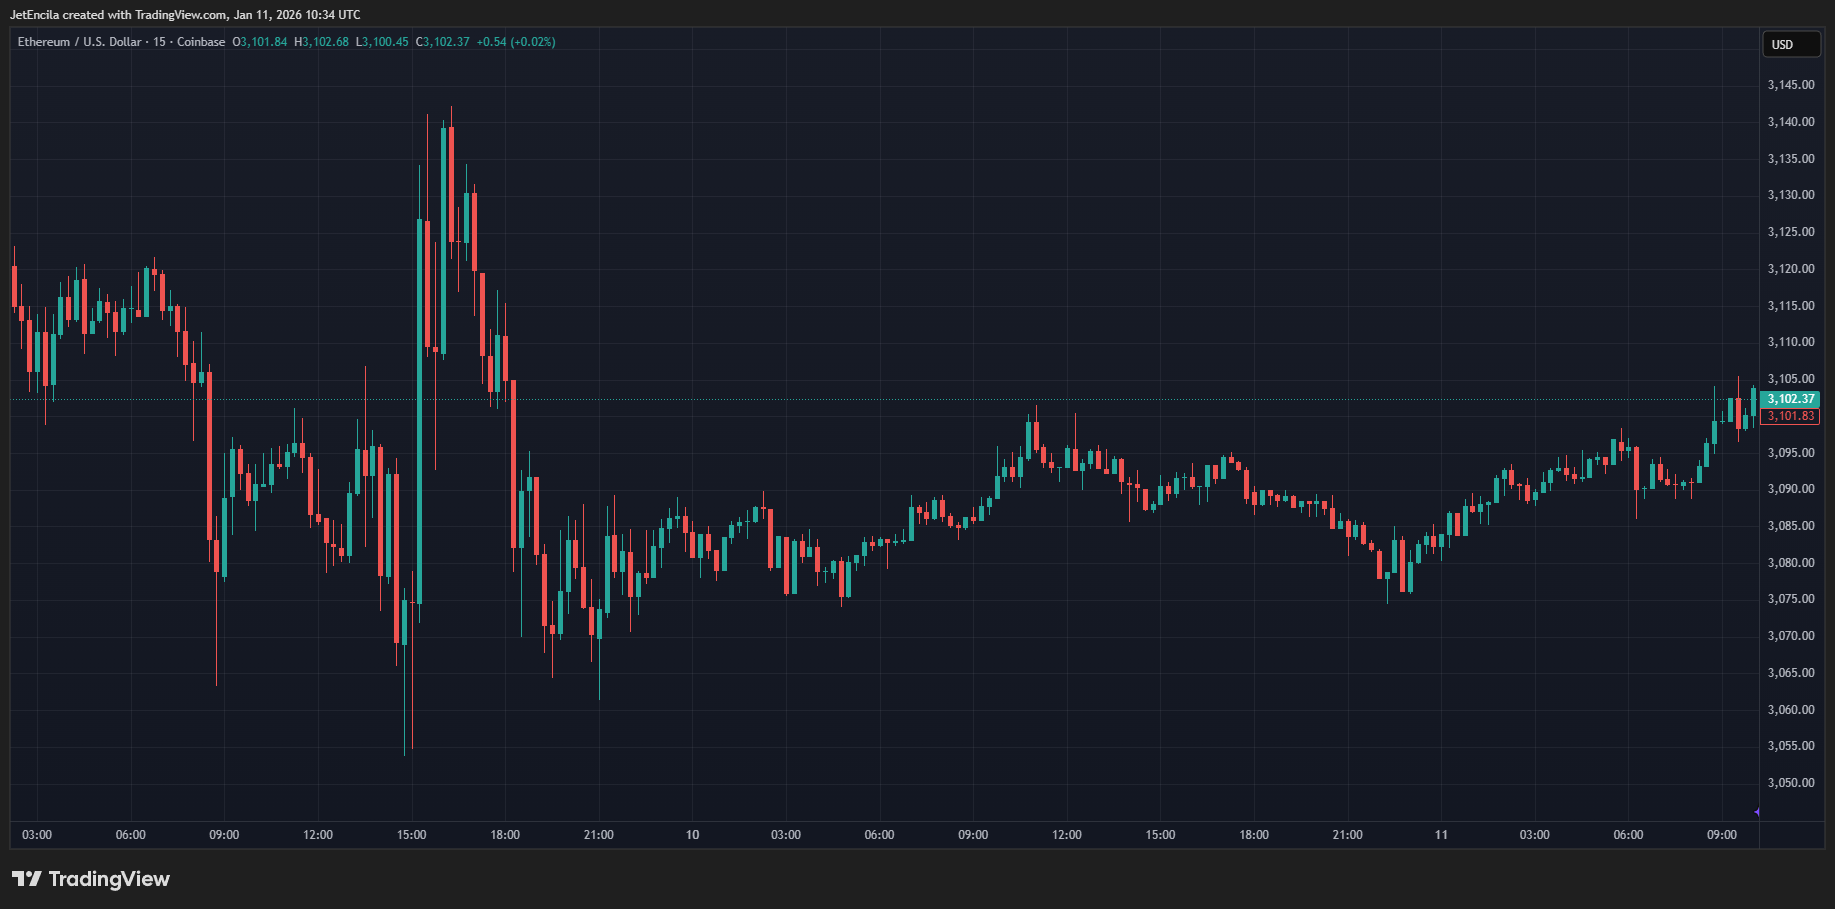
At the time of writing, Ethereum is trading at $3,100.