May 7, 2025
4 0
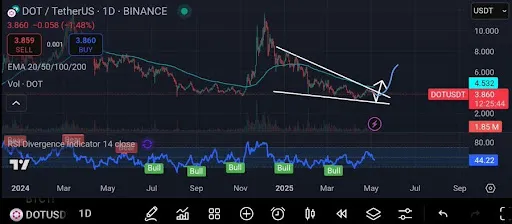
Polkadot Forms Bullish Falling Wedge Pattern Indicating Possible Breakout
Crypto analyst Jascrypto reported that Polkadot (DOT) is forming a bullish falling wedge pattern on the daily chart, indicating a potential trend reversal. This setup suggests the end of a downtrend and possible bullish breakout as DOT consolidates.
- Bearish momentum appears to be weakening, allowing buyers to enter the market.
- A breakout could lead to increased volume, marking a significant shift for DOT.
- DOT has broken out from a multi-month falling wedge pattern, signaling easing downward pressure.
- The asset is testing the 100-day and 200-day Exponential Moving Averages (EMAs), key resistance levels.
- A close above these EMAs would validate the breakout and shift market sentiment.
- If momentum continues, DOT may rally towards $5.5 to $6.0.
- In a worst-case scenario, DOT could dip to $3.120, potentially setting up for a stronger rebound above $7.
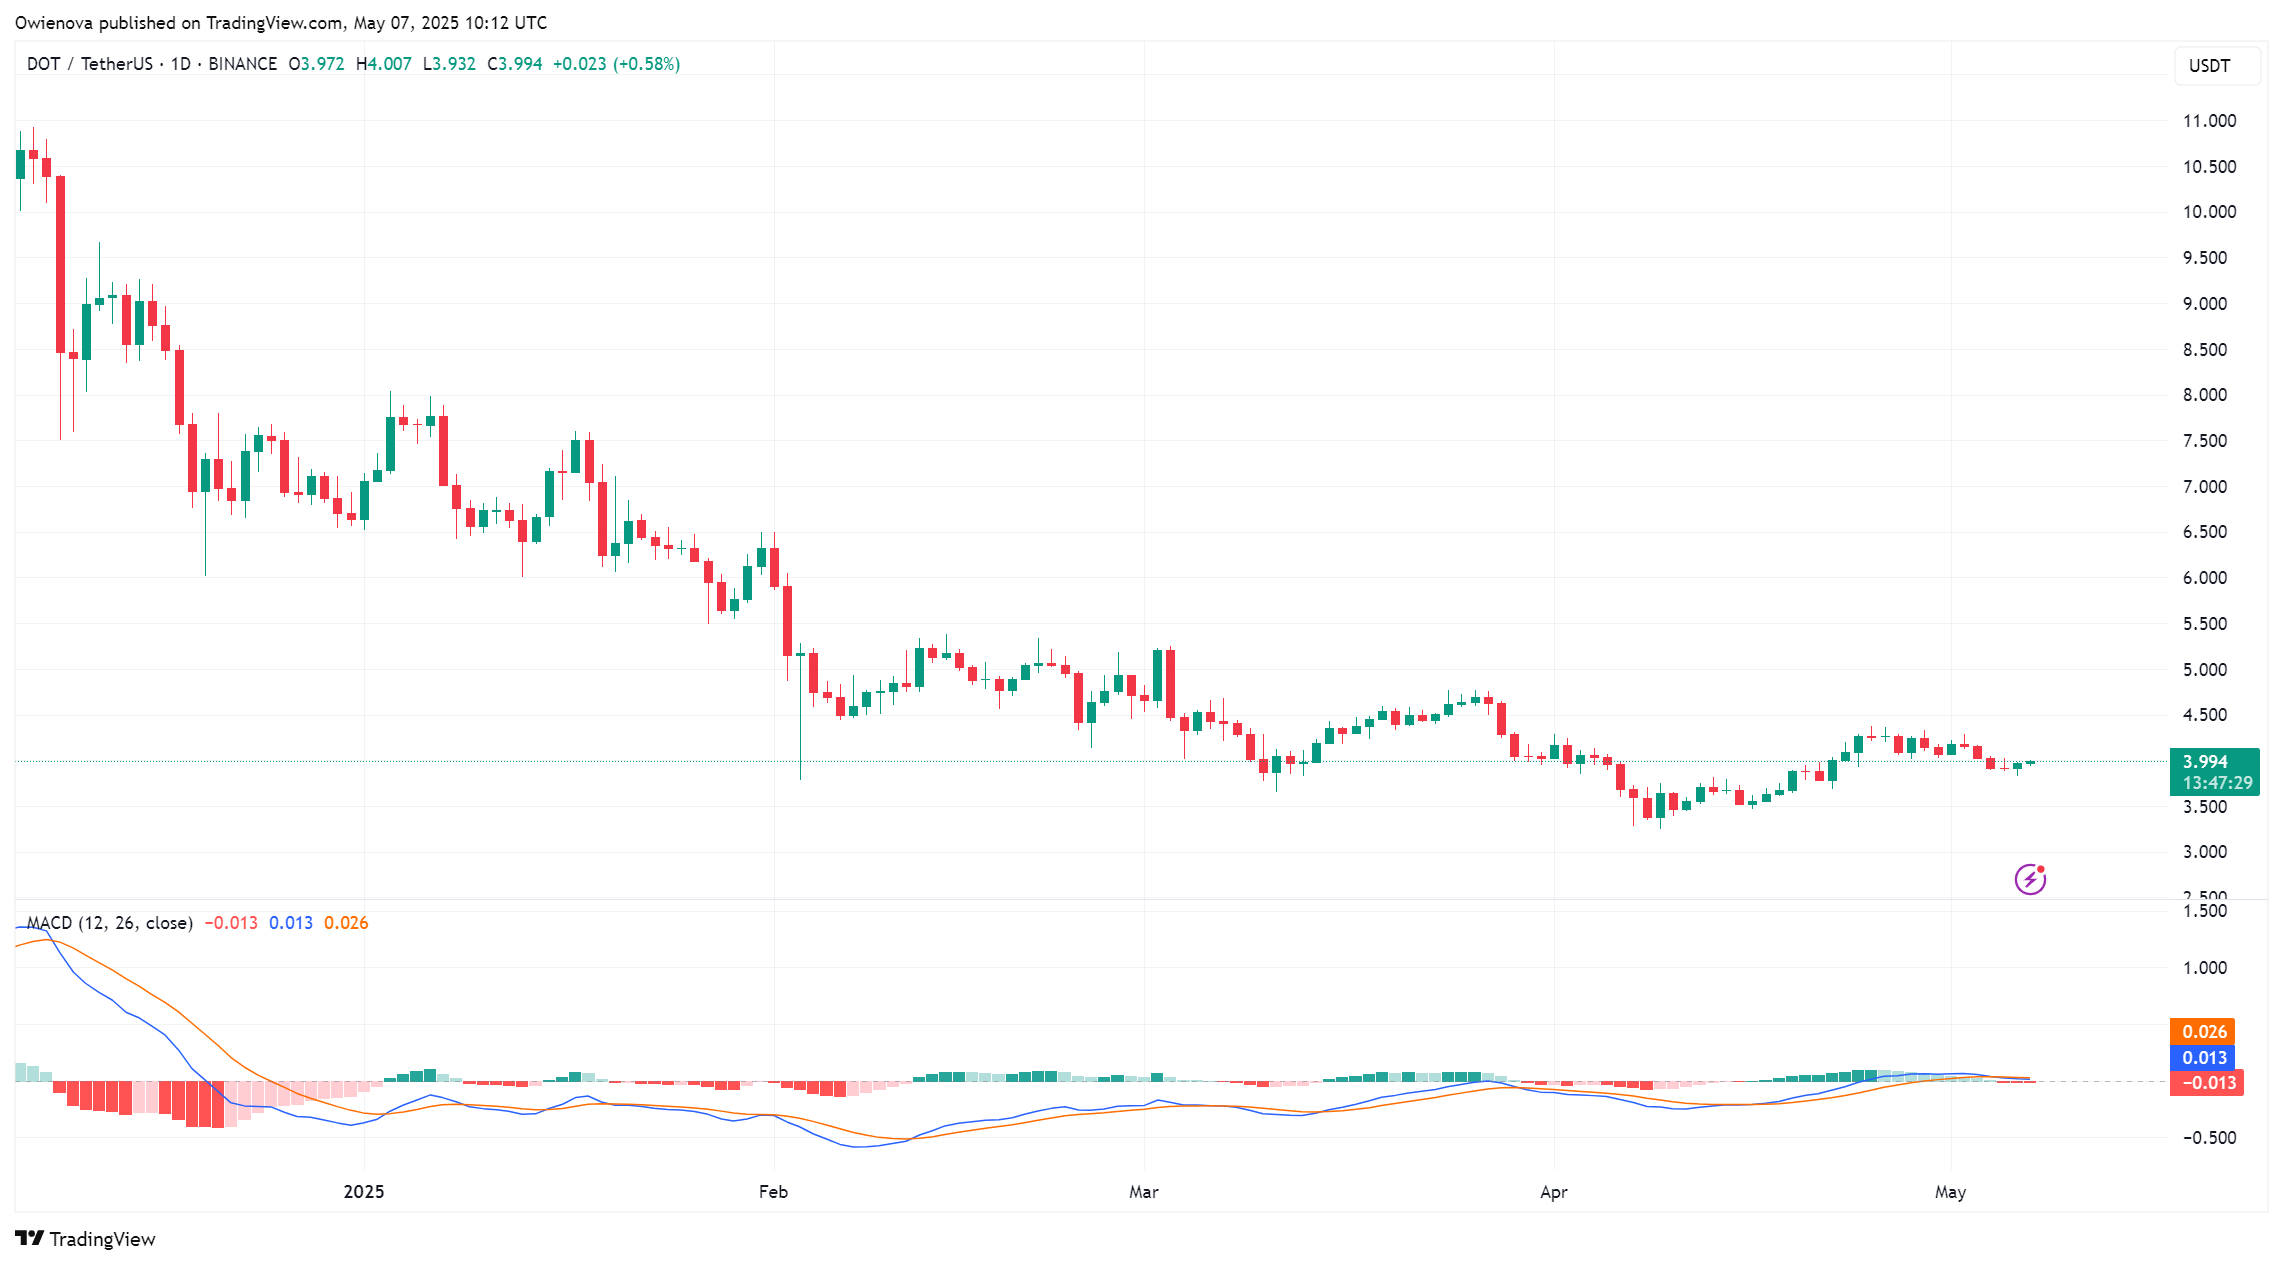
Momentum indicators are aligning positively for DOT:
- The 4-hour Relative Strength Index (RSI) has rebounded, indicating fading bearish momentum.
- The 4-hour Moving Average Convergence Divergence (MACD) shows a bullish crossover, suggesting the beginning of an uptrend.
These signals indicate a favorable shift in DOT's momentum, setting the stage for a potential continuation of the breakout if price action remains strong.