Polkadot Maintains Key Demand Level with Potential to Reach $11
Polkadot (DOT) is currently in a consolidation phase, trading below $6 after a 30% rally since last Friday. This sideways movement has introduced volatility, but market conditions indicate that DOT may be preparing for its next significant move. Despite encountering temporary resistance at the $6 level, the asset retains a bullish structure.
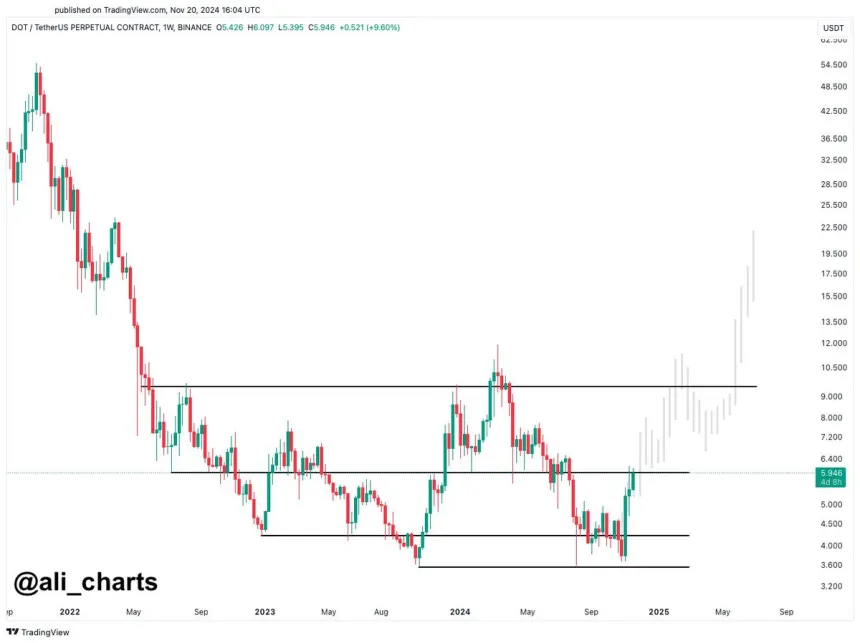
Analyst Ali Martinez has provided technical analysis showing Polkadot's resilience. He notes that DOT is holding above a critical demand zone, suggesting potential for a breakout. Growing interest and optimism around Polkadot are evident as it positions itself for another bullish leg.
Polkadot, recognized for its robust interoperability solutions, continues to attract attention in a market favoring quality projects. The upcoming days will be crucial for determining whether DOT can leverage its recent momentum to surpass key resistance levels.
Polkadot Preparing For A Breakout
Polkadot seems poised for a breakout as it maintains bullish momentum following a pullback from the $6 resistance. After a nearly 10% retracement, DOT stabilized above the critical $5.7 demand zone, indicating continued buyer control. This stability has generated optimism among investors and analysts, framing the current price action as a setup for a potential rally.
Martinez recently highlighted Polkadot’s weekly price chart, noting its strength in holding above the $3.6 support level. If momentum persists, he suggests DOT could reach $11 in the coming weeks, representing significant gains from current levels.

Martinez predicts that if DOT consolidates above $11, it could pave the way for a surge to $22, aligning with positive expectations for the broader altcoin market.
With favorable fundamentals and technical setups, Polkadot's ability to overcome resistance levels is under scrutiny. Successful predictions could reaffirm DOT's status as a key player in the crypto market.
DOT Price Action: Technical Details
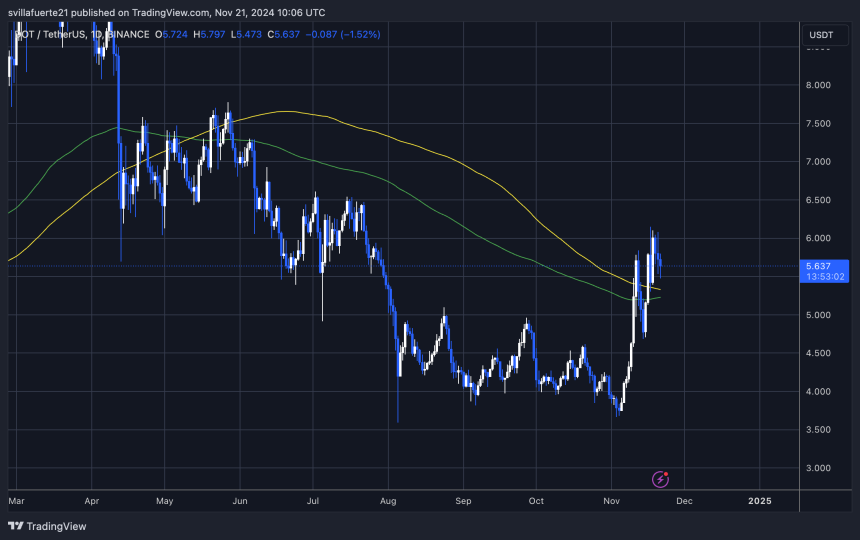
Polkadot is trading at $5.6, above the critical 200-day Moving Average (MA) at $5.3. Surpassing this indicator signifies strong bullish sentiment, indicating long-term strength as buyers gain traction. The price also holds above the $5.6 demand level, which was vital support during June and July before its recent recovery.

This regained demand level at $5.6 has renewed investor optimism, as maintaining this zone could facilitate further bullish momentum. If DOT sustains above this level in the coming days, it may target new supply zones, with the next objective around $6.5.
The combination of breaking the 200-day MA and reclaiming a significant demand level indicates DOT's potential for an upward trajectory. However, continued buying pressure is essential to navigate resistance and pursue higher targets. Currently, focus remains on DOT’s ability to consolidate above $5.6, a crucial indicator for future climbing prospects.
Featured image from Dall-E, chart from TradingView