Apr 29, 2025
0 0
Polkadot Price Remains Within $4 to $12 Range for 5 Years
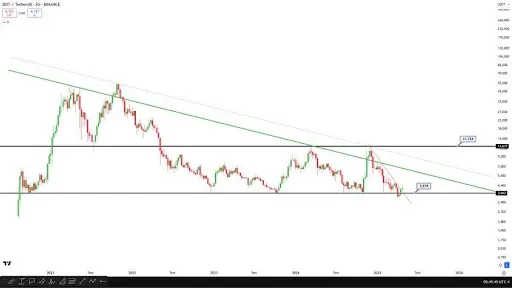
Recent analysis by Çağnur Cessur highlights that Polkadot (DOT) is trading within a defined channel on the monthly chart, ranging from $4 to $12. This long-term sideways market structure has persisted for 4 to 5 years.
Key Points
- The established support and resistance levels have been tested multiple times.
- A break above this range could indicate a new trend, whether upward or downward.
- A downtrend channel has guided market structure, acting as long-term resistance.
- If DOT breaks above this channel, it may signal a reversal towards new highs.
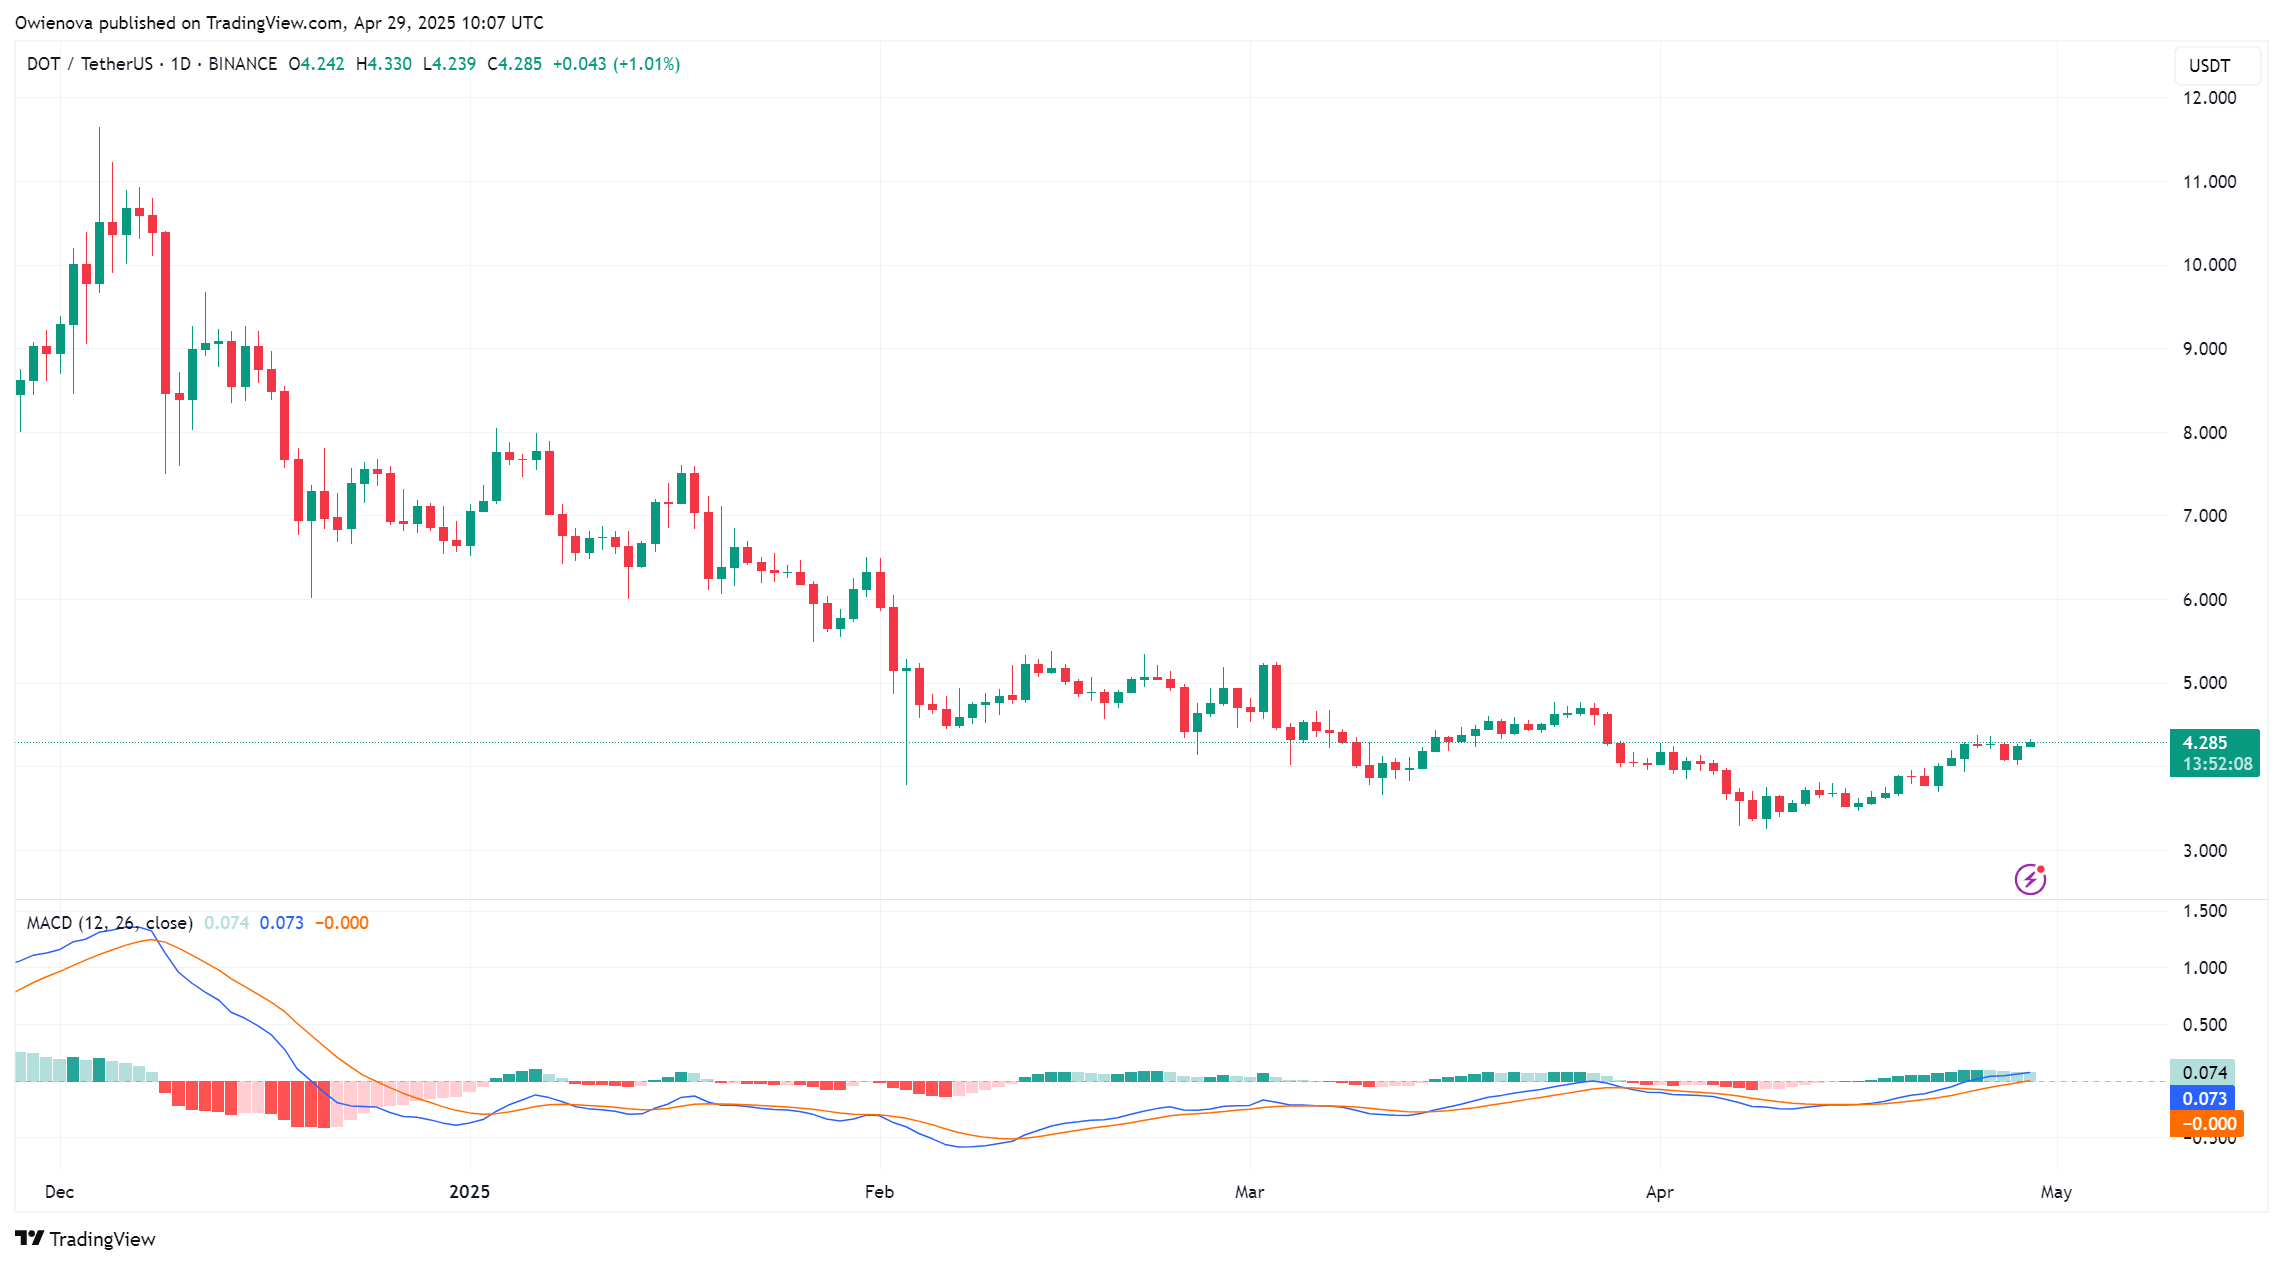
- Recently, a weekly red falling channel was breached upwards, suggesting potential bullish momentum.
- A weekly close above $4.70 may increase chances of moving toward $10.
Bear Case
- The critical $4 support level is vital for maintaining price structure.
- A drop below $4 could lead to increased bearish sentiment and pressure.
- This move may invalidate recent bullish trends and raise the risk of retesting all-time lows.
- Strategic re-entry points will be significant for both short and long-term holders.