Polkadot Price Surges 130% in 30 Days Amid Increased Network Activity
Polkadot (#DOT) has experienced a 130% price increase in 30 days, breaking above the $10 mark, which enhances its recovery momentum. The uptrend is supported by network growth and increasing parachains.
Polkadot Breakout Rally Crosses Key Resistance
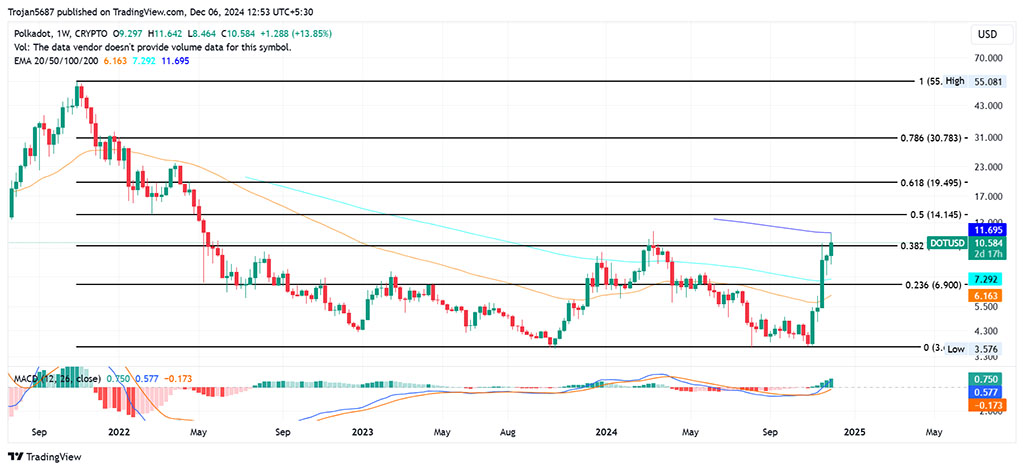
The weekly price chart shows a significant change with a parabolic rise, marking the fifth consecutive week of bullish performance, totaling a 186.79% increase. Starting from $3.6979, Polkadot's price surpassed the 38.20% Fibonacci level at $10.262, completing a double-bottom reversal from the $3.60 base.

Source: Tradingview
The current rally is approaching the neckline at the 38.20% Fibonacci level, with the weekly candle nearing the 52-week high of $11.89. A close above this neckline would confirm the bullish breakout and suggest further upward movement.
The MACD and signal lines are in positive territory, indicating increased trend momentum reflected in the linear trend of positive histograms.
Polkadot Relay and Parachains Hits New Highs
Recent data indicates a surge in network activity, with new addresses on the Polkadot relay chain reaching a 30-day high of 3.5K, surpassing November's previous peak of 2.8K.

In November 2024, new addresses on the relay chain totaled 56.22K, reflecting over a 100% increase from September's 25.66K.

The seven-day moving average for transfers over the Relay chain was 14.55K, while monthly parachain transfers reached an all-time high of 9.07 million, exceeding October's 8.81 million.
Will Polkadot Surge 2x?
Fibonacci analysis suggests upside targets at the 61.80% and 78.60% levels of $19.49 and $30.78. A breakout above the neckline at $10.262 with a weekly close may signal further extension next week.
With a market cap of $16.21 billion and trading volume of $1.42 billion, Polkadot's escalating activity on the relay and parachains indicates rising adoption, supporting potential price growth.