Polygon Price Faces Bearish Pressure as Super User Growth Reaches 1.5 Million
The Polygon price in the 4-hour chart indicates a pullback phase, forming a lower-high pattern and establishing a short-term resistance trendline. This supply barrier has limited bullish growth, leading to multiple higher price rejections. Currently, Polygon is experiencing its fifth bearish reversal from the bearish trendline, indicating ongoing downward pressure.
Polygon Price Analysis
The pullback phase has breached the 23.60% Fibonacci level at $0.4901. With the loss of the $0.50 psychological mark, Polygon is trading at $0.4874.
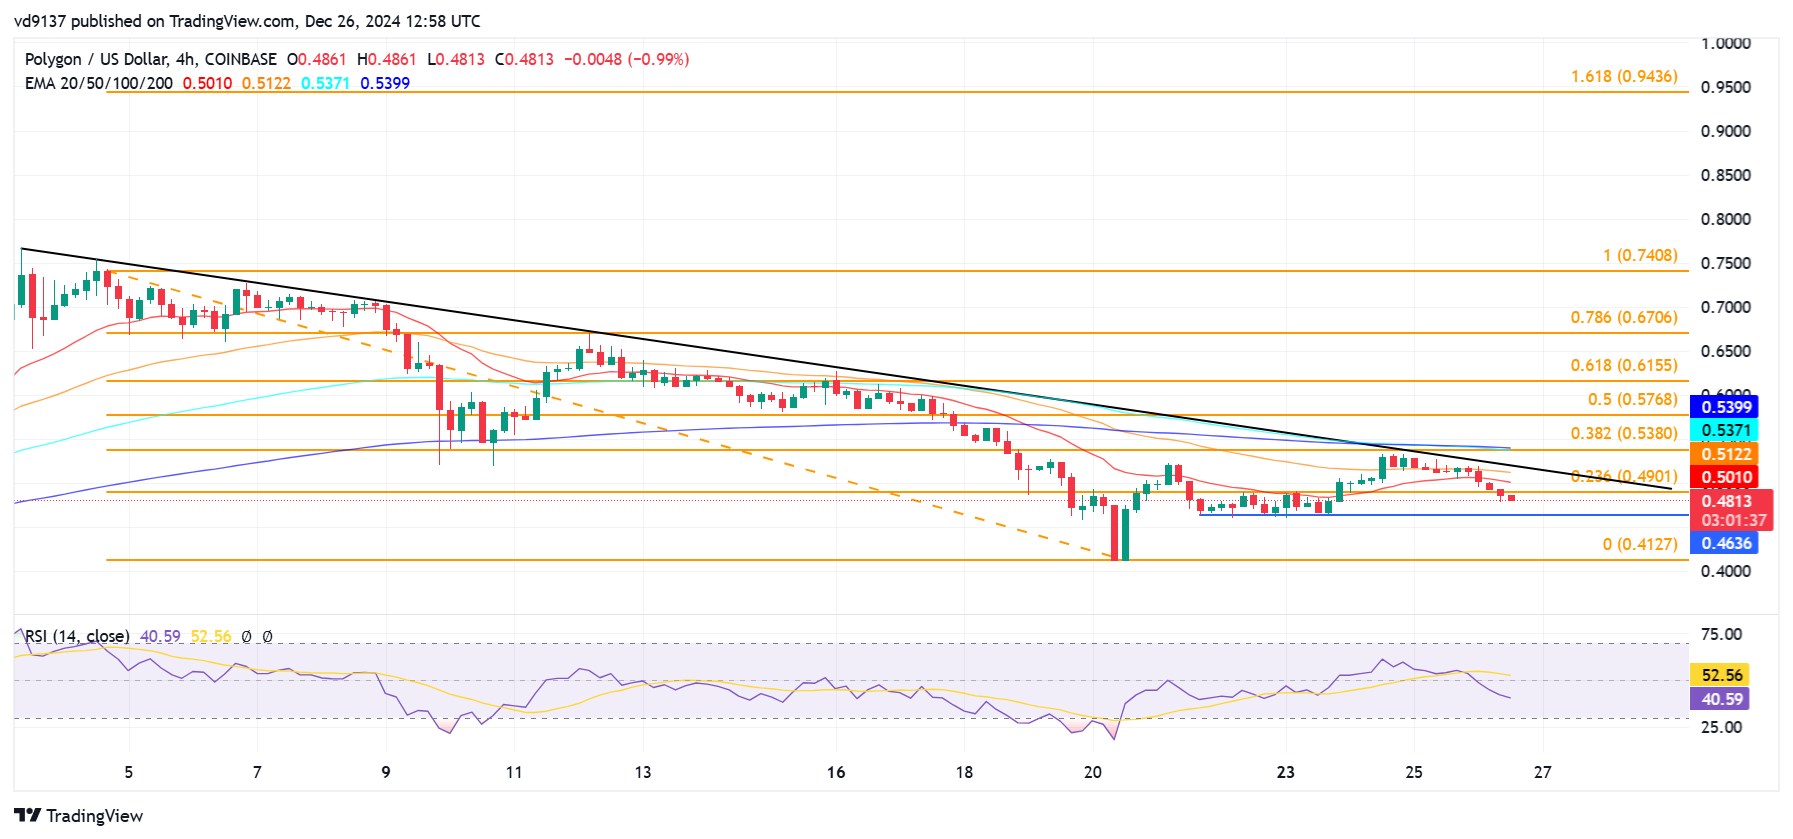
This reflects an intraday correction of 5.16% following a 2.73% decline previously. These sharp price drops indicate increased bearish sentiment. The 4-hour RSI line has significantly risen during the recent recovery; however, it has fallen below the 50% threshold. Additionally, the 100 and 200 EMA lines have crossed bearishly, suggesting a bearish outlook for Polygon.
Polygon’s Achievements in 2024
Despite short-term corrections and a negative year-to-date growth of 52%, the Polygon Network achieved notable success in 2024. It added the most new super users to the crypto market, defined as users making over 100 transactions, surpassing other chains.
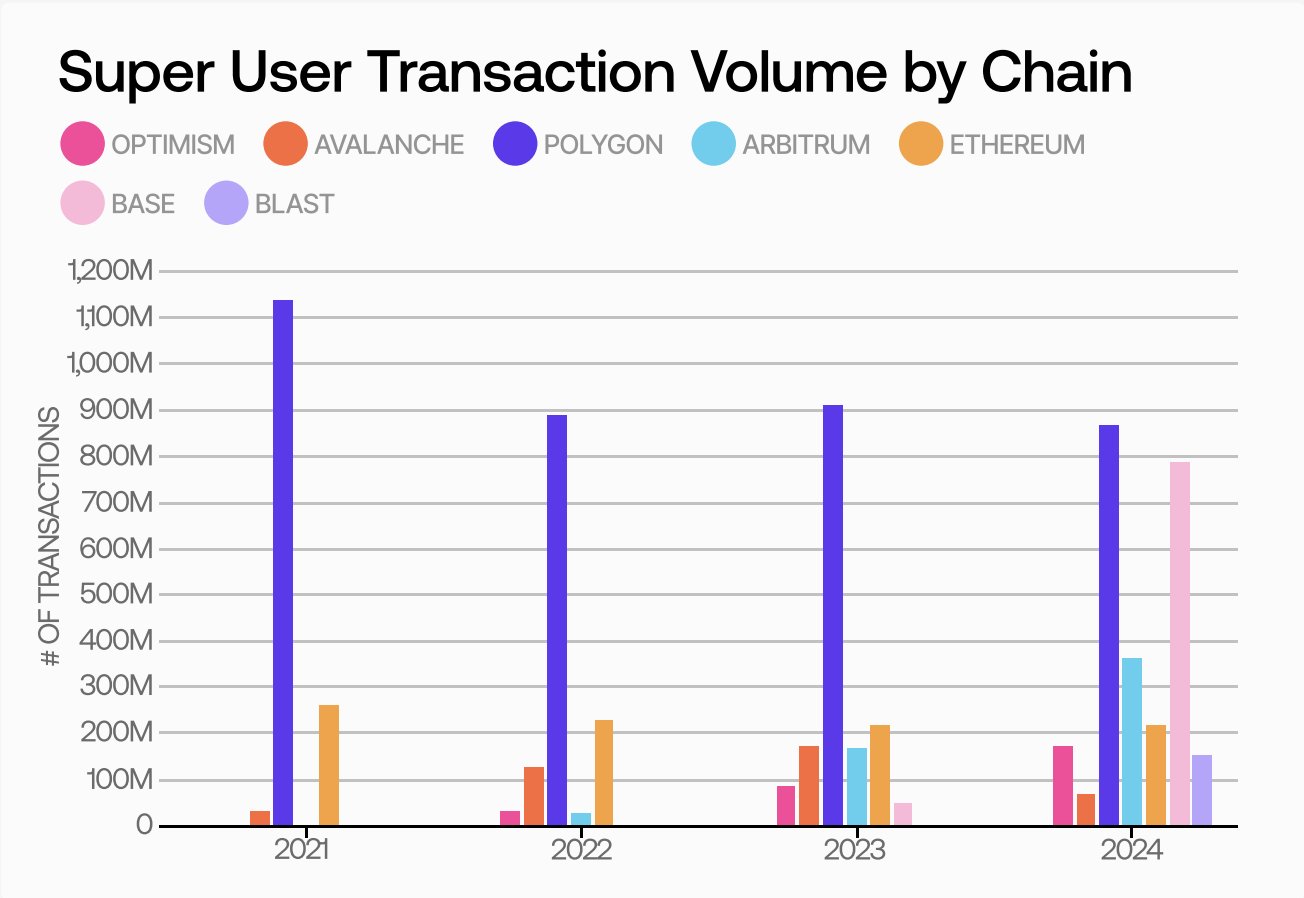
Polygon recorded an inflow of 1.5 million super users, totaling 867.7 million monthly transactions. This demonstrates substantial growth and adoption of the network. Competitor Optimism ranked second with nearly 800 million monthly super user transactions.
Supply and Demand Zones
According to supply and demand analysis, Polygon is encountering an immediate supply zone between $0.4875 and $0.5016, encompassing 23.8 million tokens across 2.33k addresses.
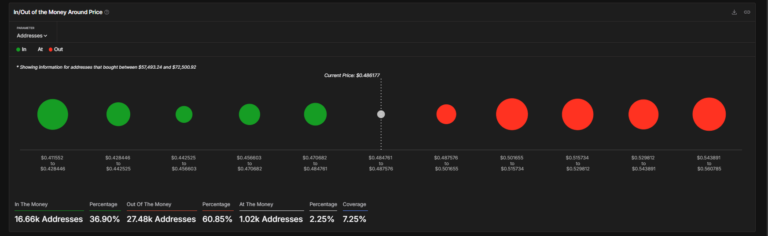
The support zone ranges from $0.47 to $0.4847, holding 9.11 million Polygon tokens among 3.08k addresses. The significant difference in volume between the demand and supply zones suggests that the Polygon price may continue its pullback phase, indicating potential sustained bearish control in the near term.
Polygon Price Targets
As Polygon price declines below crucial support levels, the pullback phase may retest the $0.4678 support level. If this level fails, the $0.4127 support could also be tested. A potential bullish reversal remains possible, but bearish momentum prevails. A bullish reversal from the $0.4636 support due to bullish RSI divergence could lead to a trendline breakout rally, potentially restoring confidence among bullish traders. In this scenario, the 50% Fibonacci level at $0.5768 may serve as a target before the end of 2024.