Sep 26, 2025
27 4
Key Indicators to Watch in Q4: Bitcoin Seasonal Trends, XRP/BTC, Dollar Index
Key Insights for Crypto Traders in Q4 2025
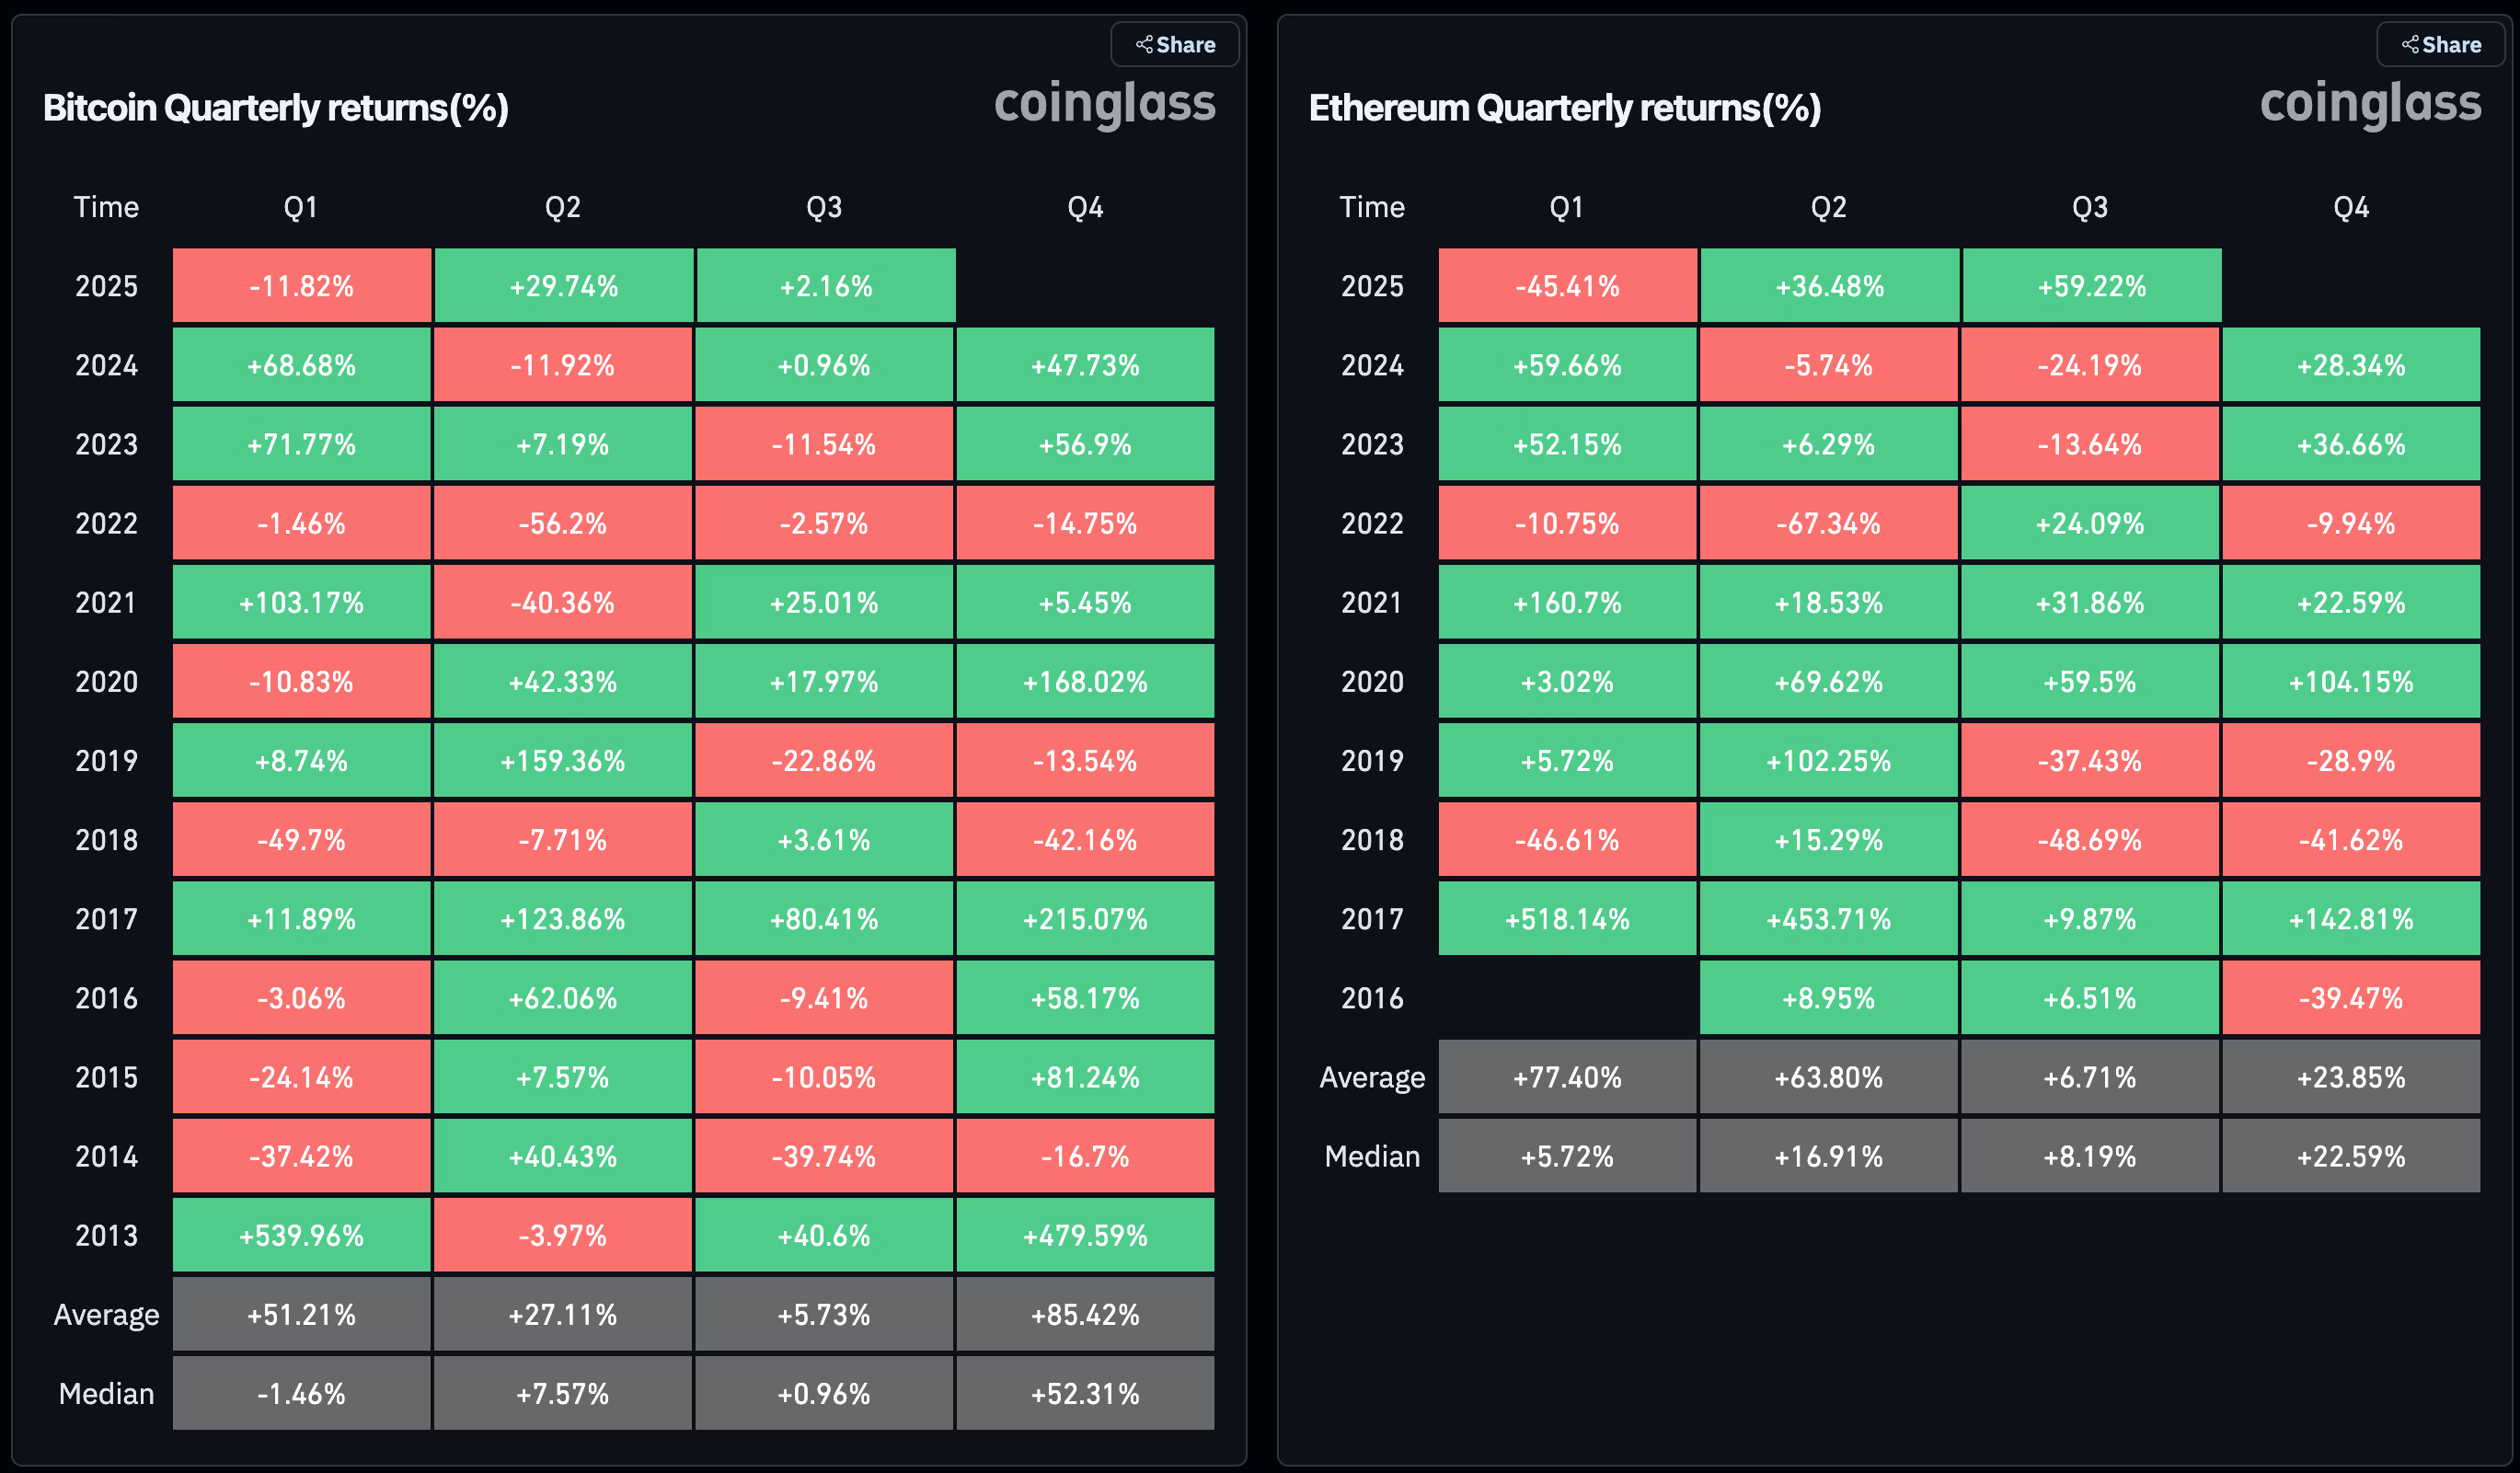
Bullish Seasonality
- Bitcoin (BTC) and Ether (ETH) show strong historical Q4 performance.
- Since 2013, BTC averages an 85% return in Q4, with November being the most bullish month at a 46% average gain.
- ETH generally performs well in the last three months of the year.
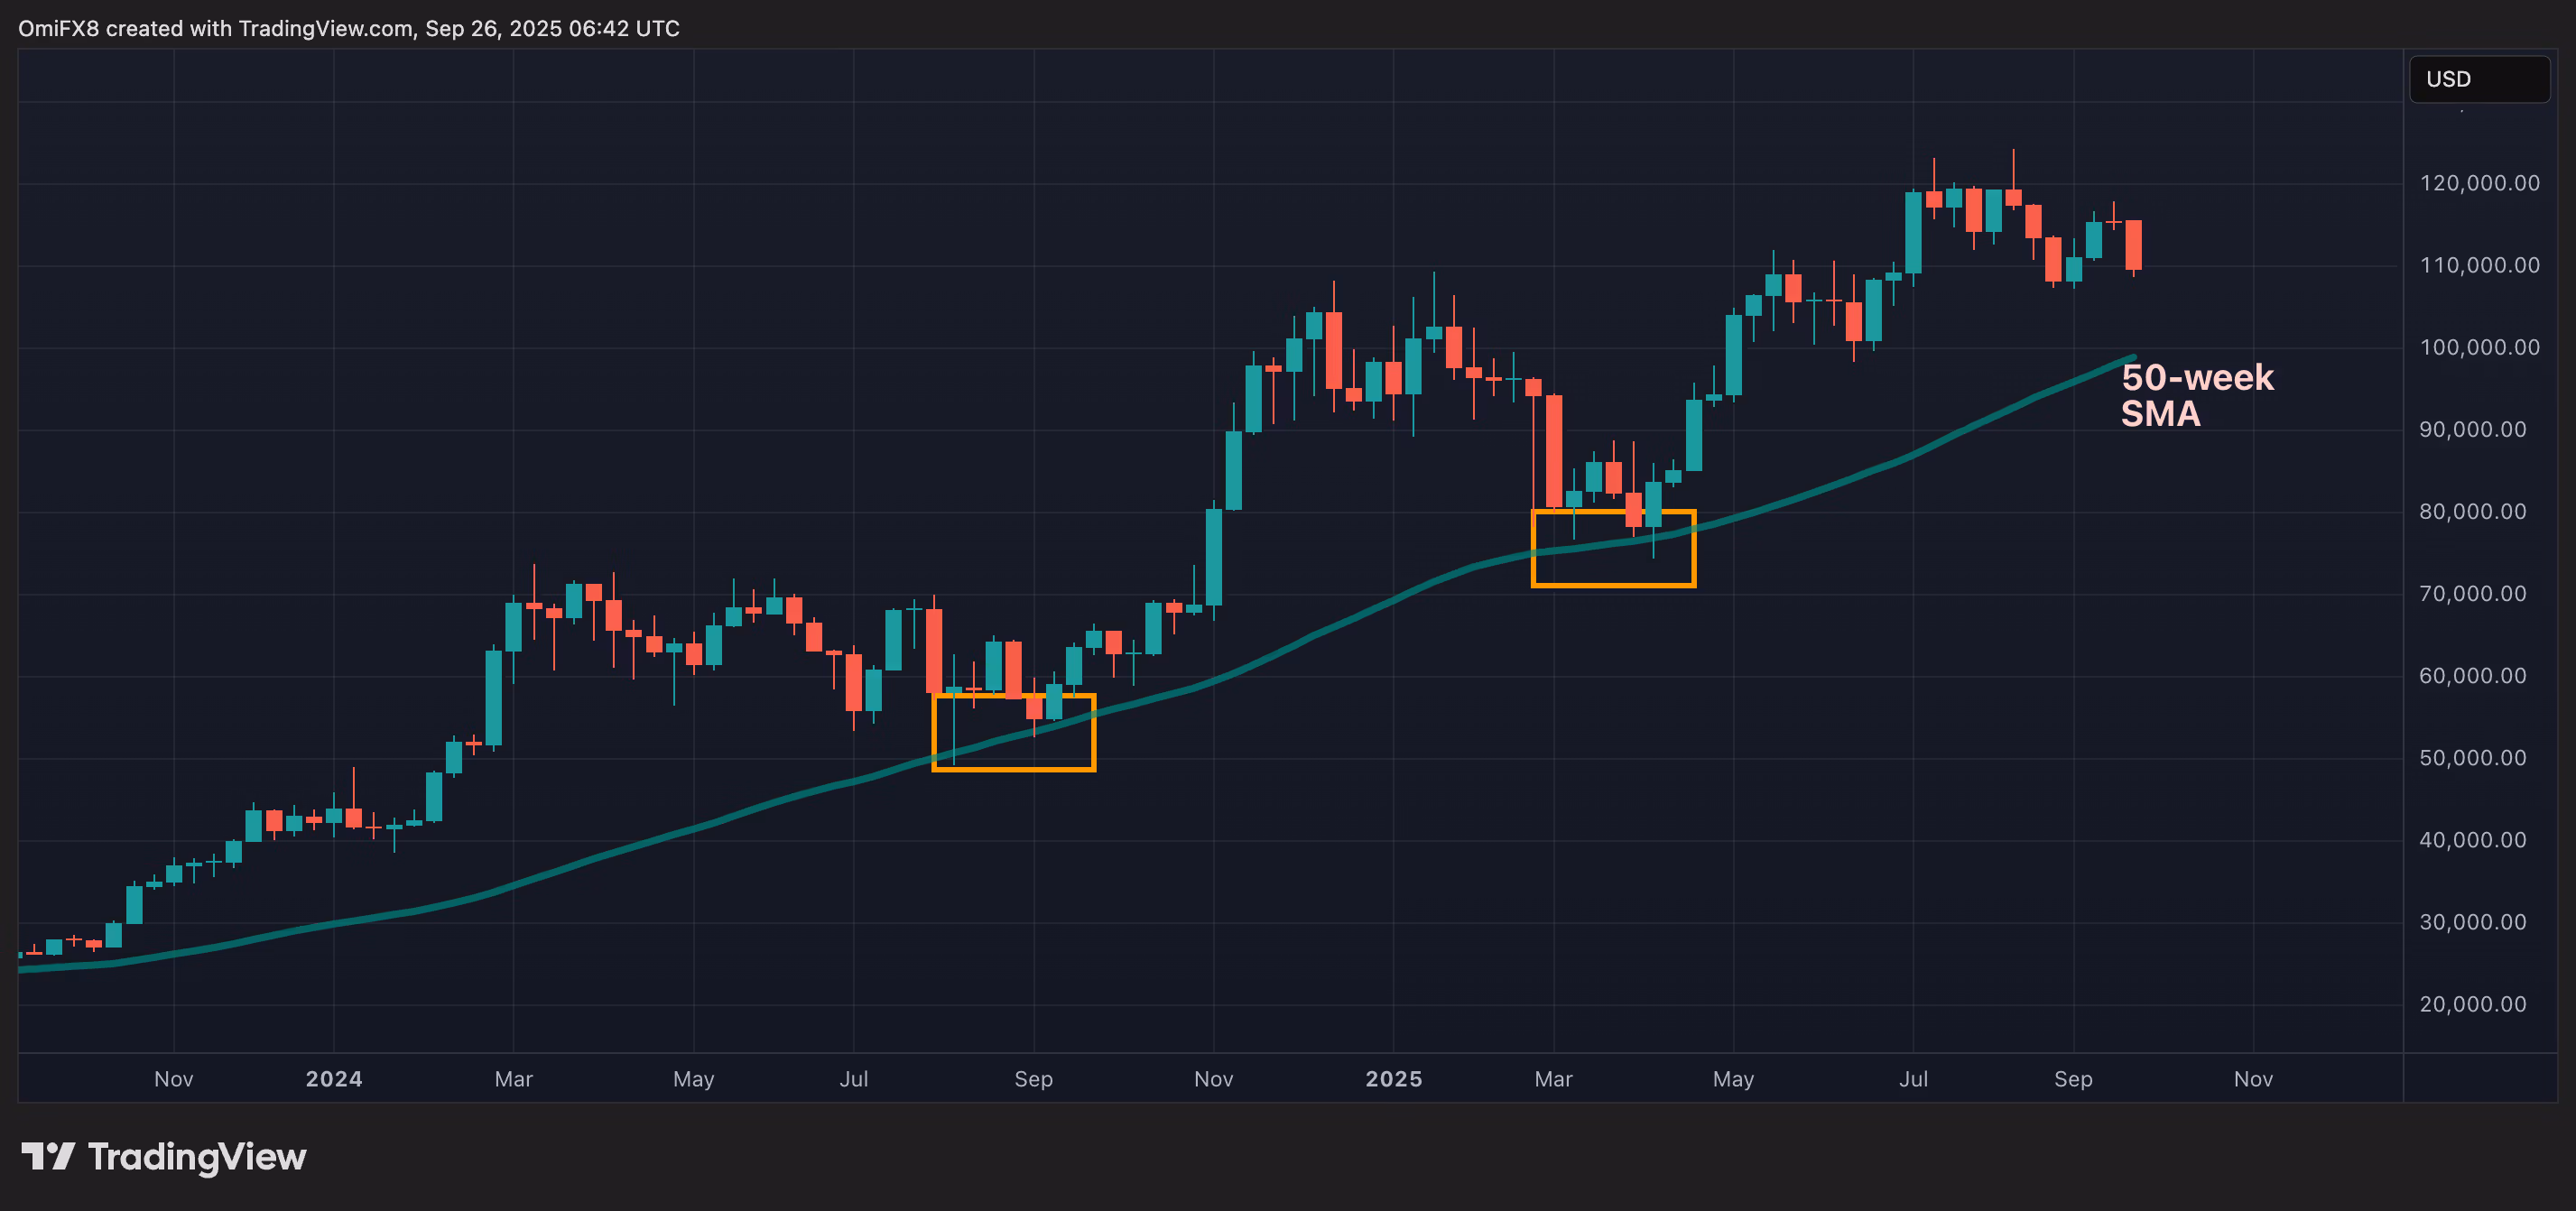
BTC's 50-week SMA Support
- Bitcoin dropped 5% this week, potentially heading towards late August lows near $107,300.
- The key level to watch is the 50-week SMA at $98,900, historically a strong support during bull runs.
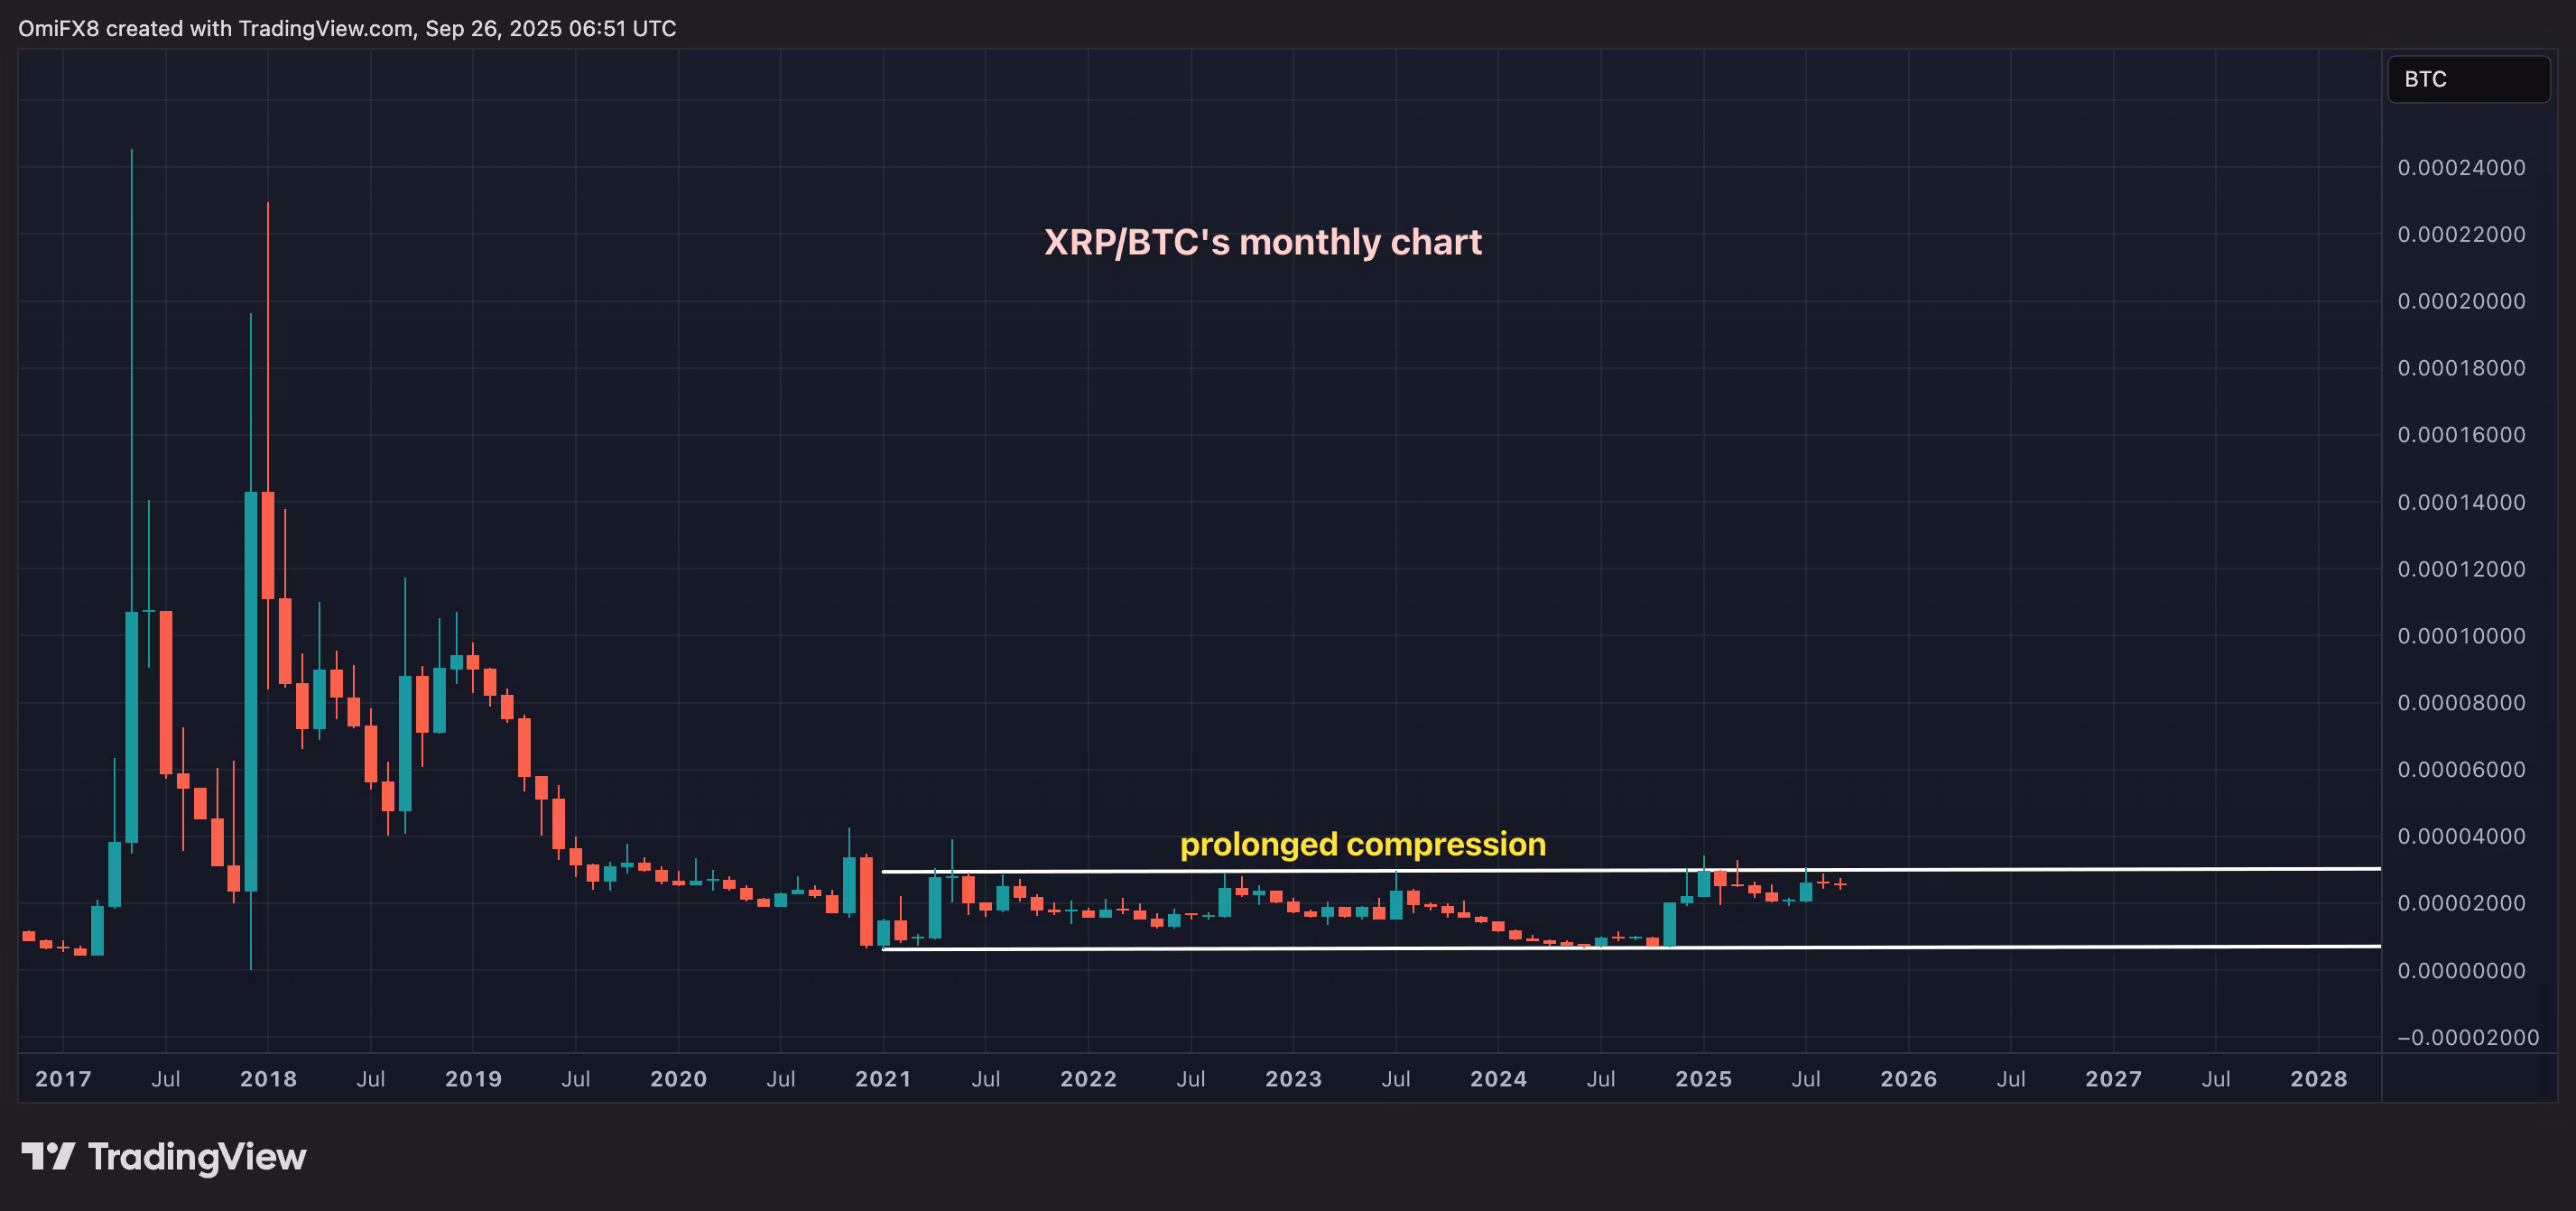
XRP/BTC Compression
- XRP has surged 32% this year but remains within a narrow trading range against BTC since early 2021.
- A potential breakout from this range could trigger a significant rally in XRP relative to BTC.
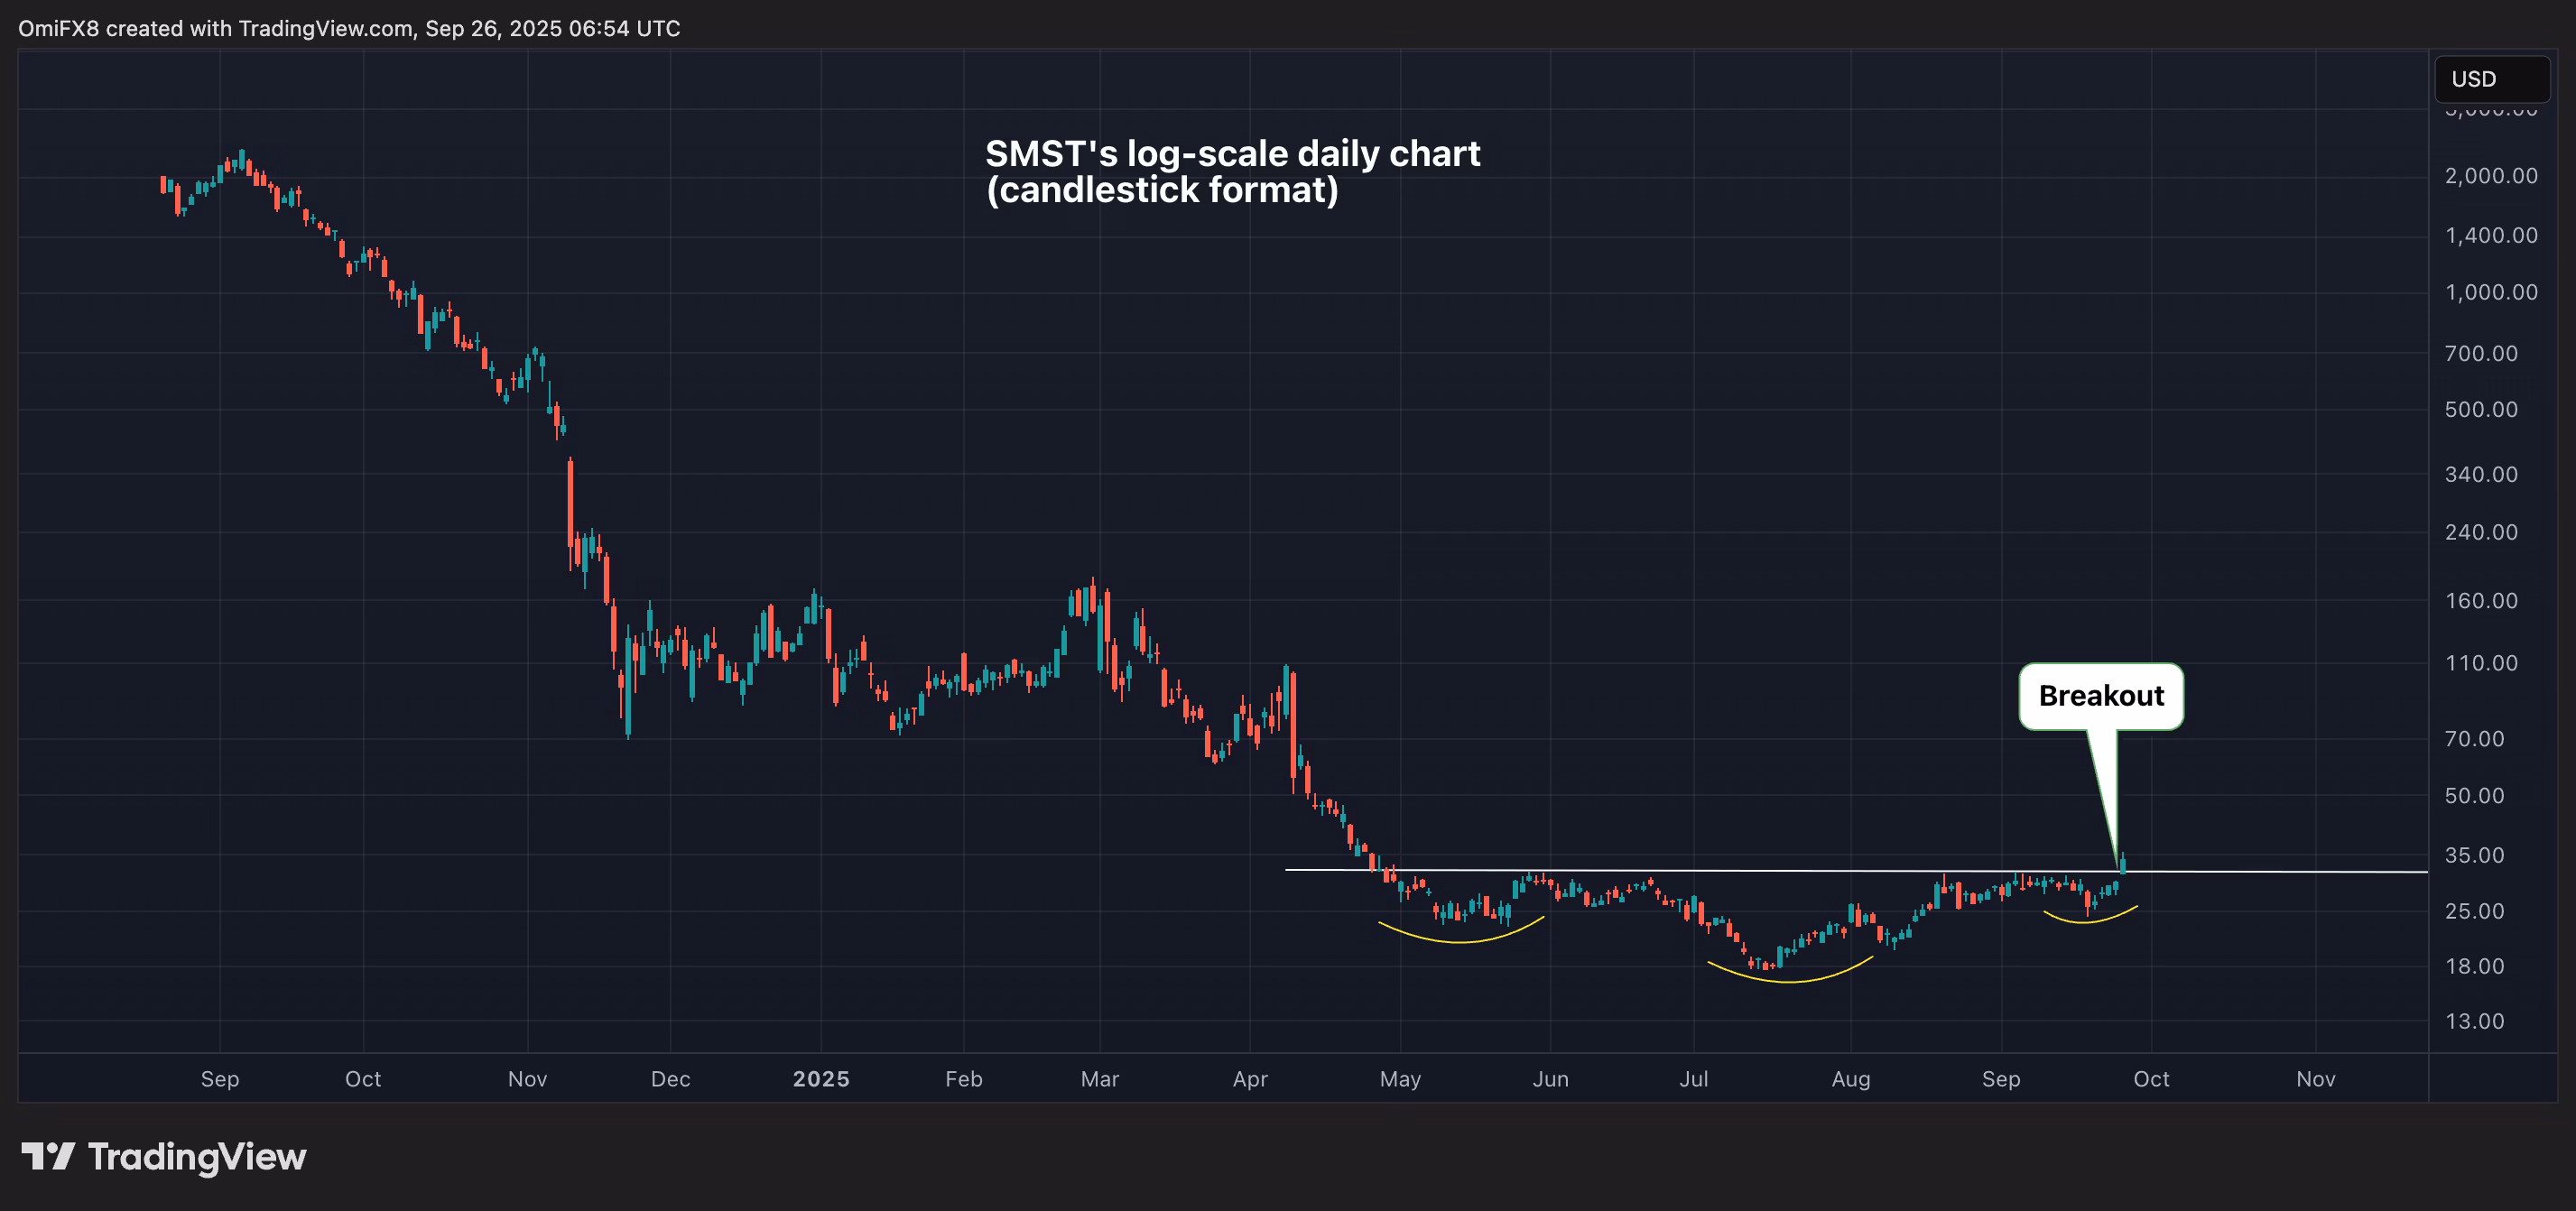
Defiance Daily Target 2x Short MSTR ETF (SMST)
- SMST ETF shows bullish signals with a price increase to $35.65, forming an inverse head-and-shoulders pattern.
- This pattern suggests a potential upward move, posing bearish implications for BTC.
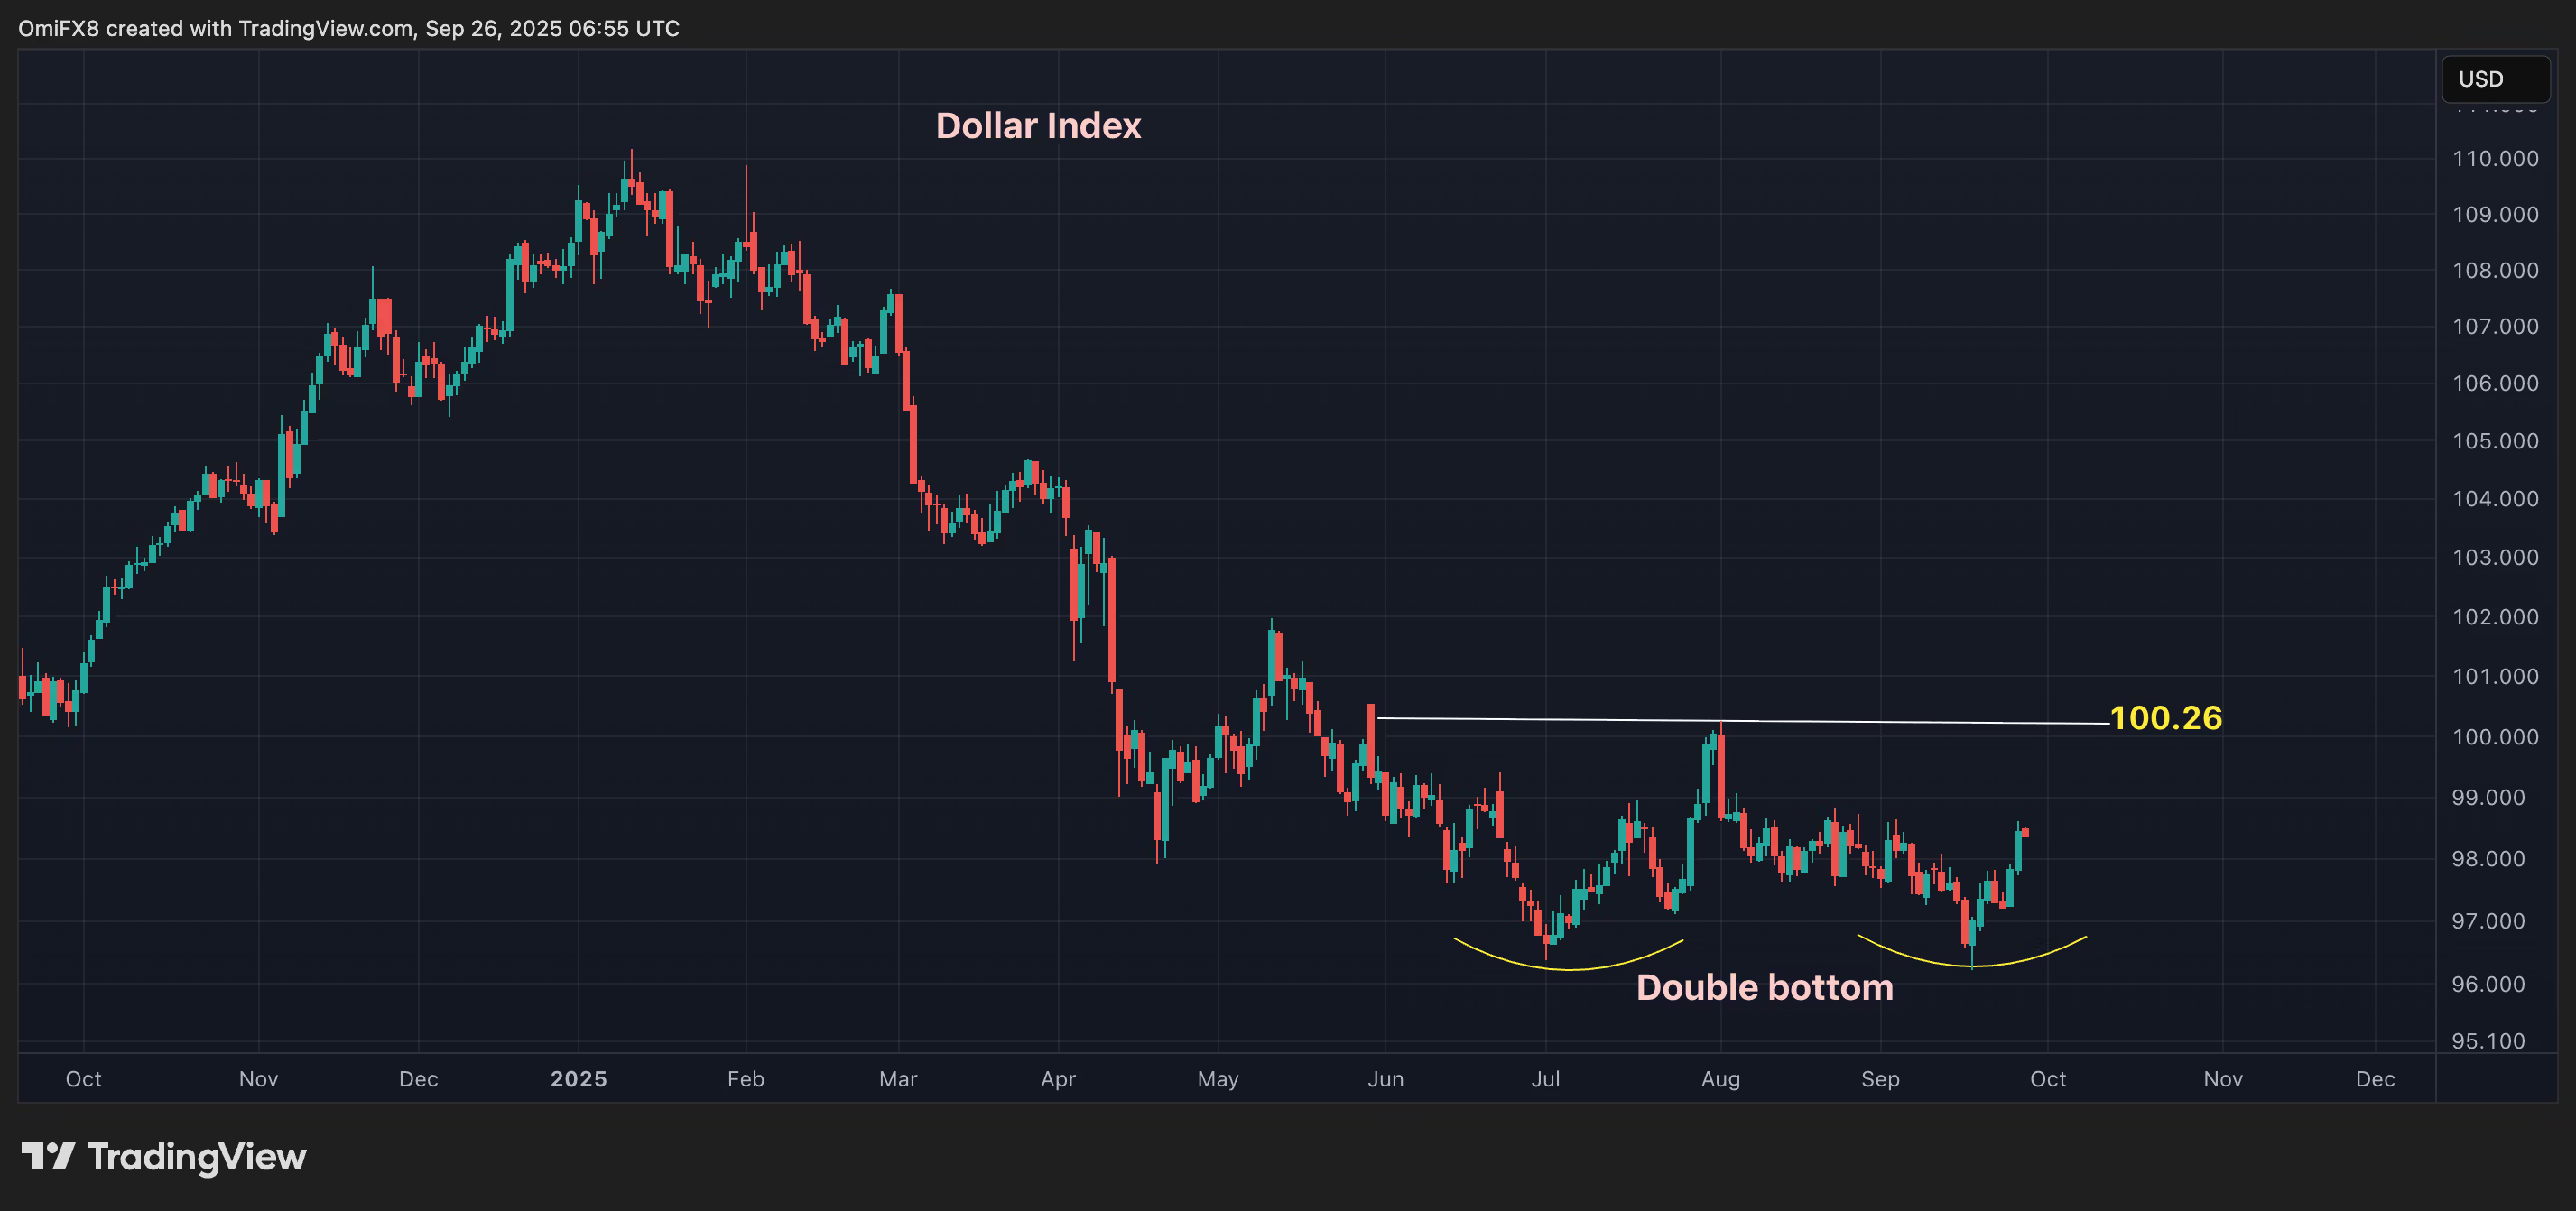
Dollar Index's Double Bottom
- The Dollar Index established a double bottom around 96.30, indicating potential for further gains.
- A move beyond 100.26 would confirm a breakout, affecting risk assets including cryptocurrencies.
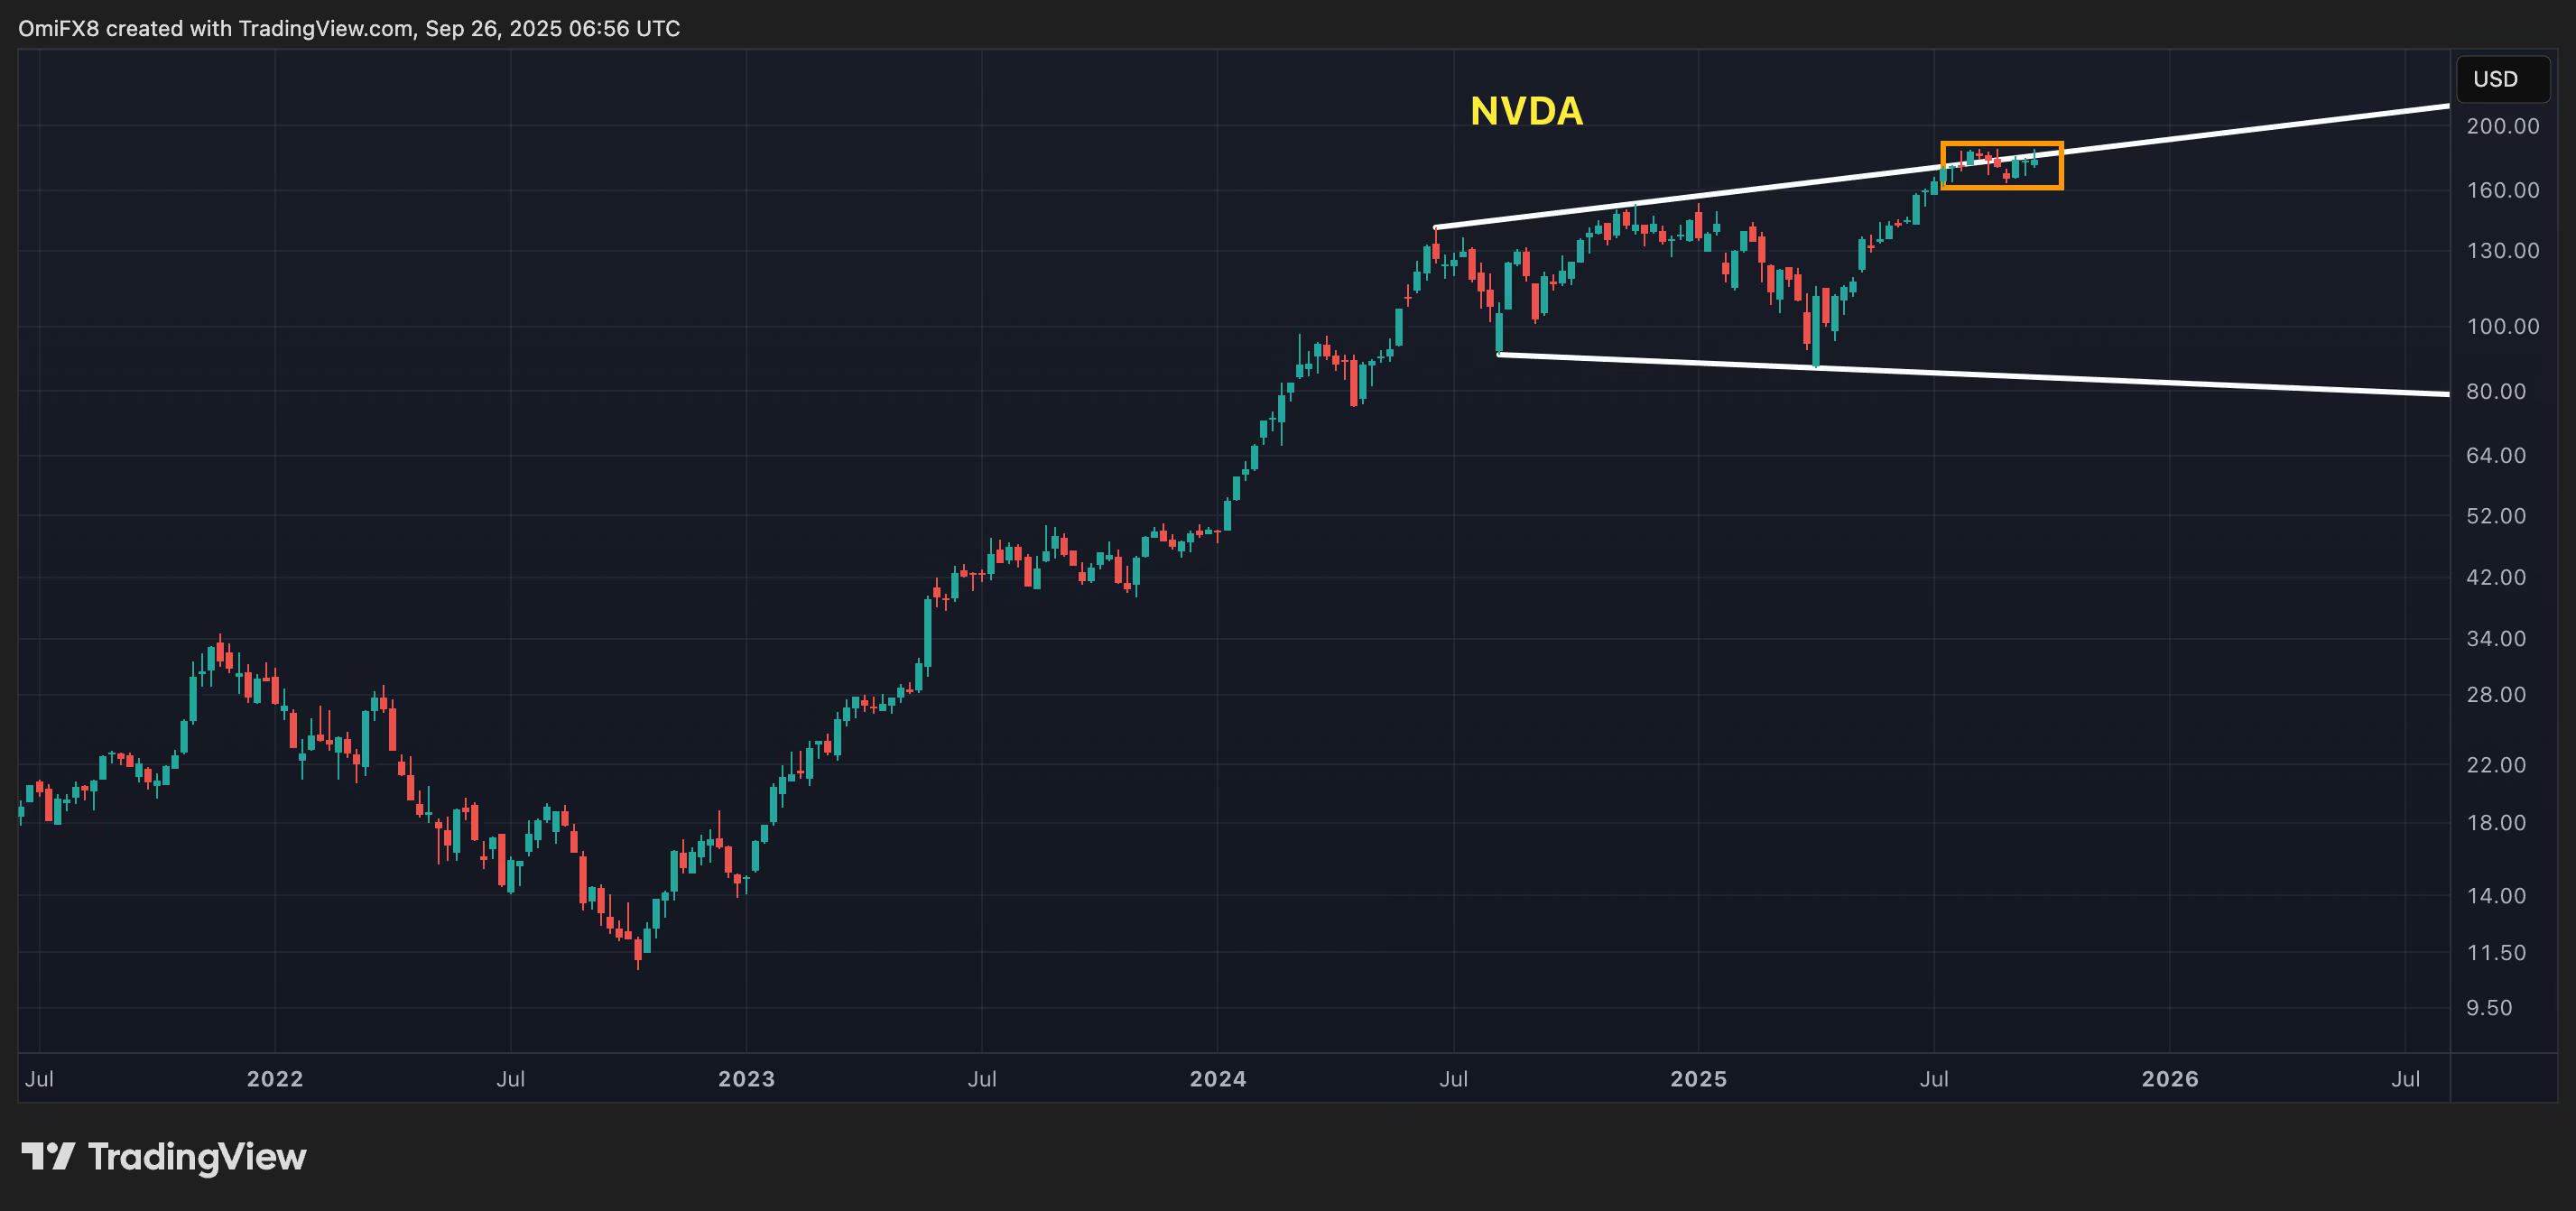
NVDA Topping?
- Nvidia (NVDA) hovers near the upper end of its broadening channel, showing signs of bullish exhaustion.
- A decline from current levels could signal a risk-off period, impacting global markets including crypto.