Jun 19, 2025
3 0
Shiba Inu (SHIB) Price Holds Steady Amid Accumulation by Large Holders
Shiba Inu (SHIB) is trading at $0.0000115, with a 19% decline over the past month and a market cap loss exceeding $2 billion since late May. Analysts suggest SHIB may be nearing a bottom, with support identified between $0.000010 and $0.000011. Accumulation by large holders has surged, indicating potential for a future rally.
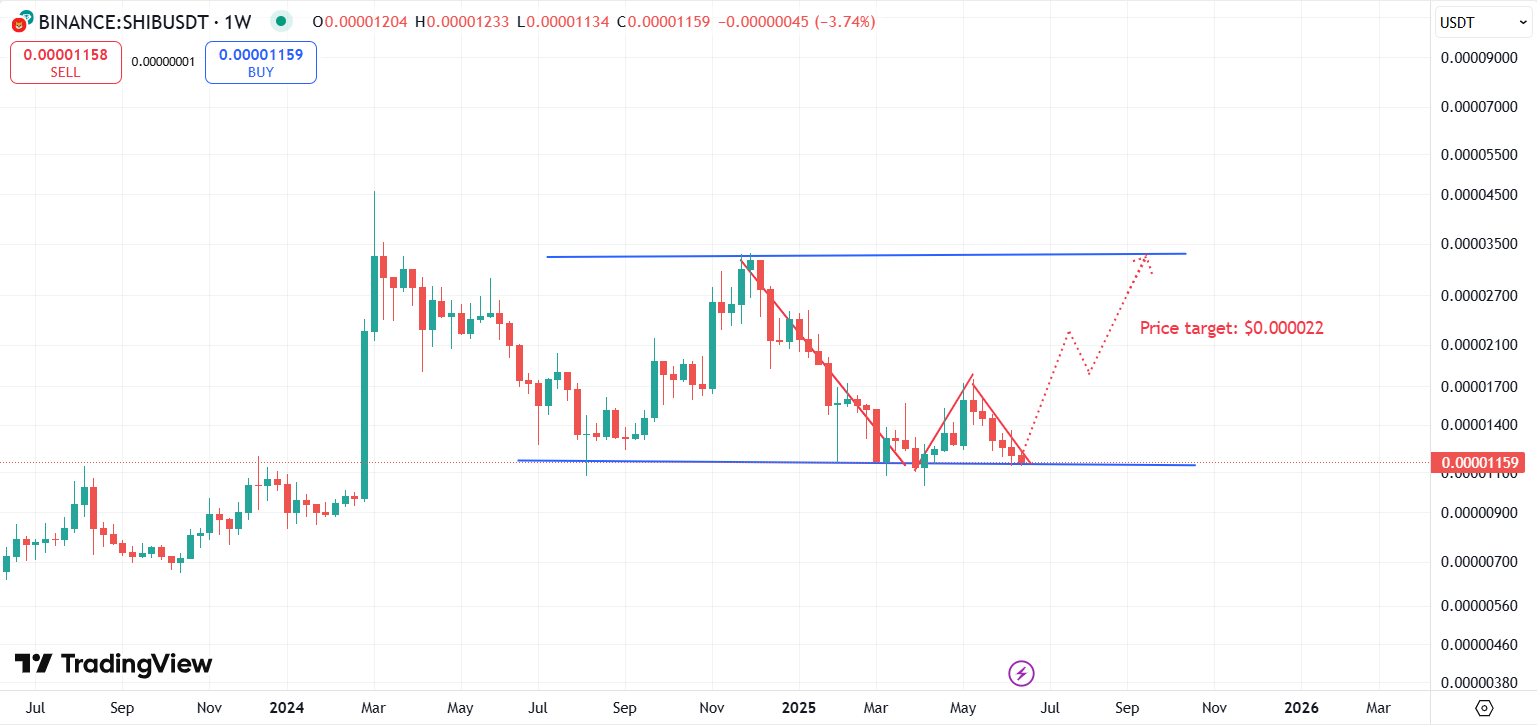
- Weekly chart shows a double-bottom pattern, typically a bullish signal.
- Potential breakout target is $0.000022, nearly double current price.
- Daily RSI suggests SHIB is approaching oversold territory, indicating possible reversal.
- Bollinger Bands are narrowing, hinting at near-term consolidation.
- A daily close above $0.0000124 could indicate bullish recovery.
- MACD remains bearish; a drop below $0.0000110 may lead to further declines.
Potential double bottom pattern on SHIB weekly chart | Source: TradingView
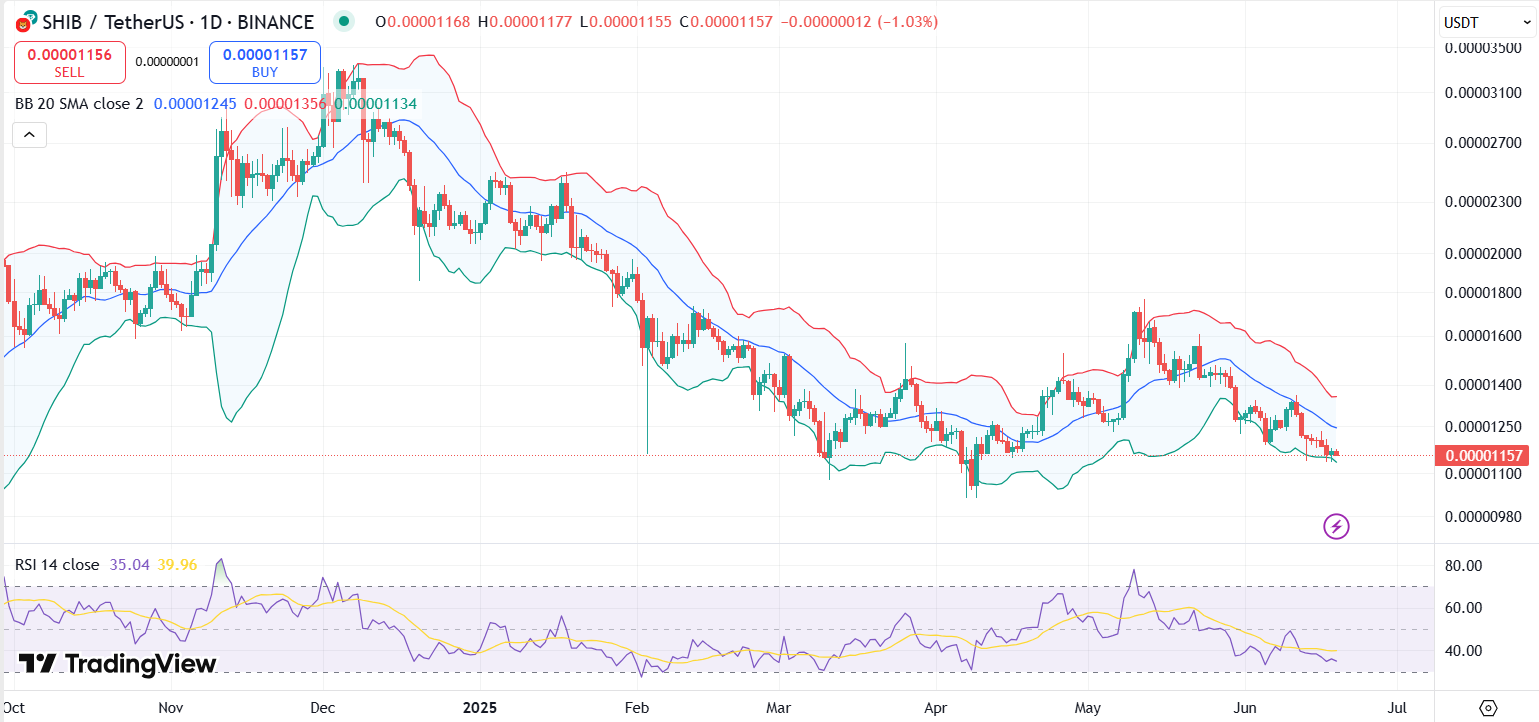
SHIB price chart with RSI and Bollinger Bands | Source: TradingView
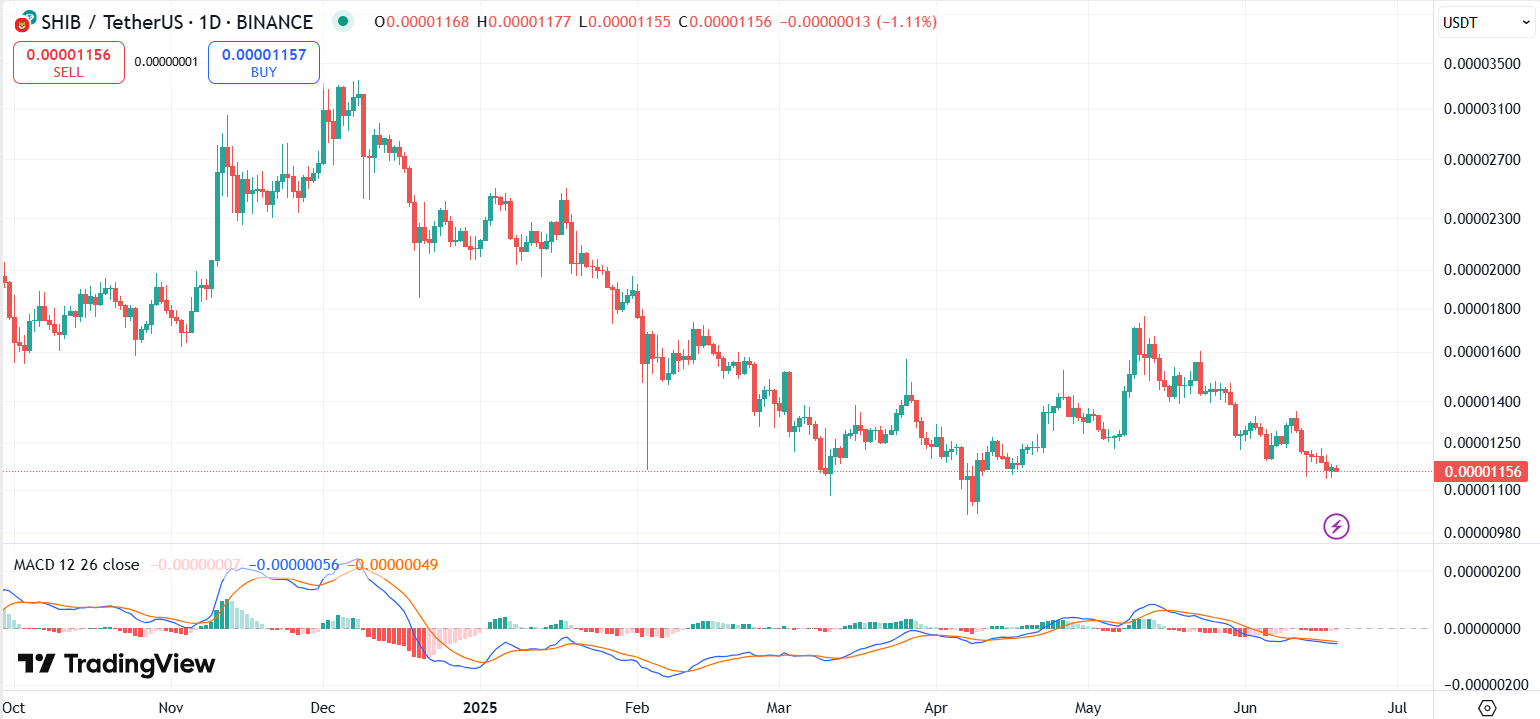
SHIB price chart with MACD | Source: Trading View
Solaxy Presale Gains Traction
Solaxy, a Layer 2 blockchain solution for Solana, aims to enhance transaction throughput and reduce network congestion. The native token, $SOLX, is utilized for gas fees, incentivizing participation, and governance.
- Token Price: $0.001766
- Funds Raised: $54.7 million
- Payment Methods: Crypto, Card
- Ticker: SOLX
- Chain: Solana