May 29, 2025
6 1
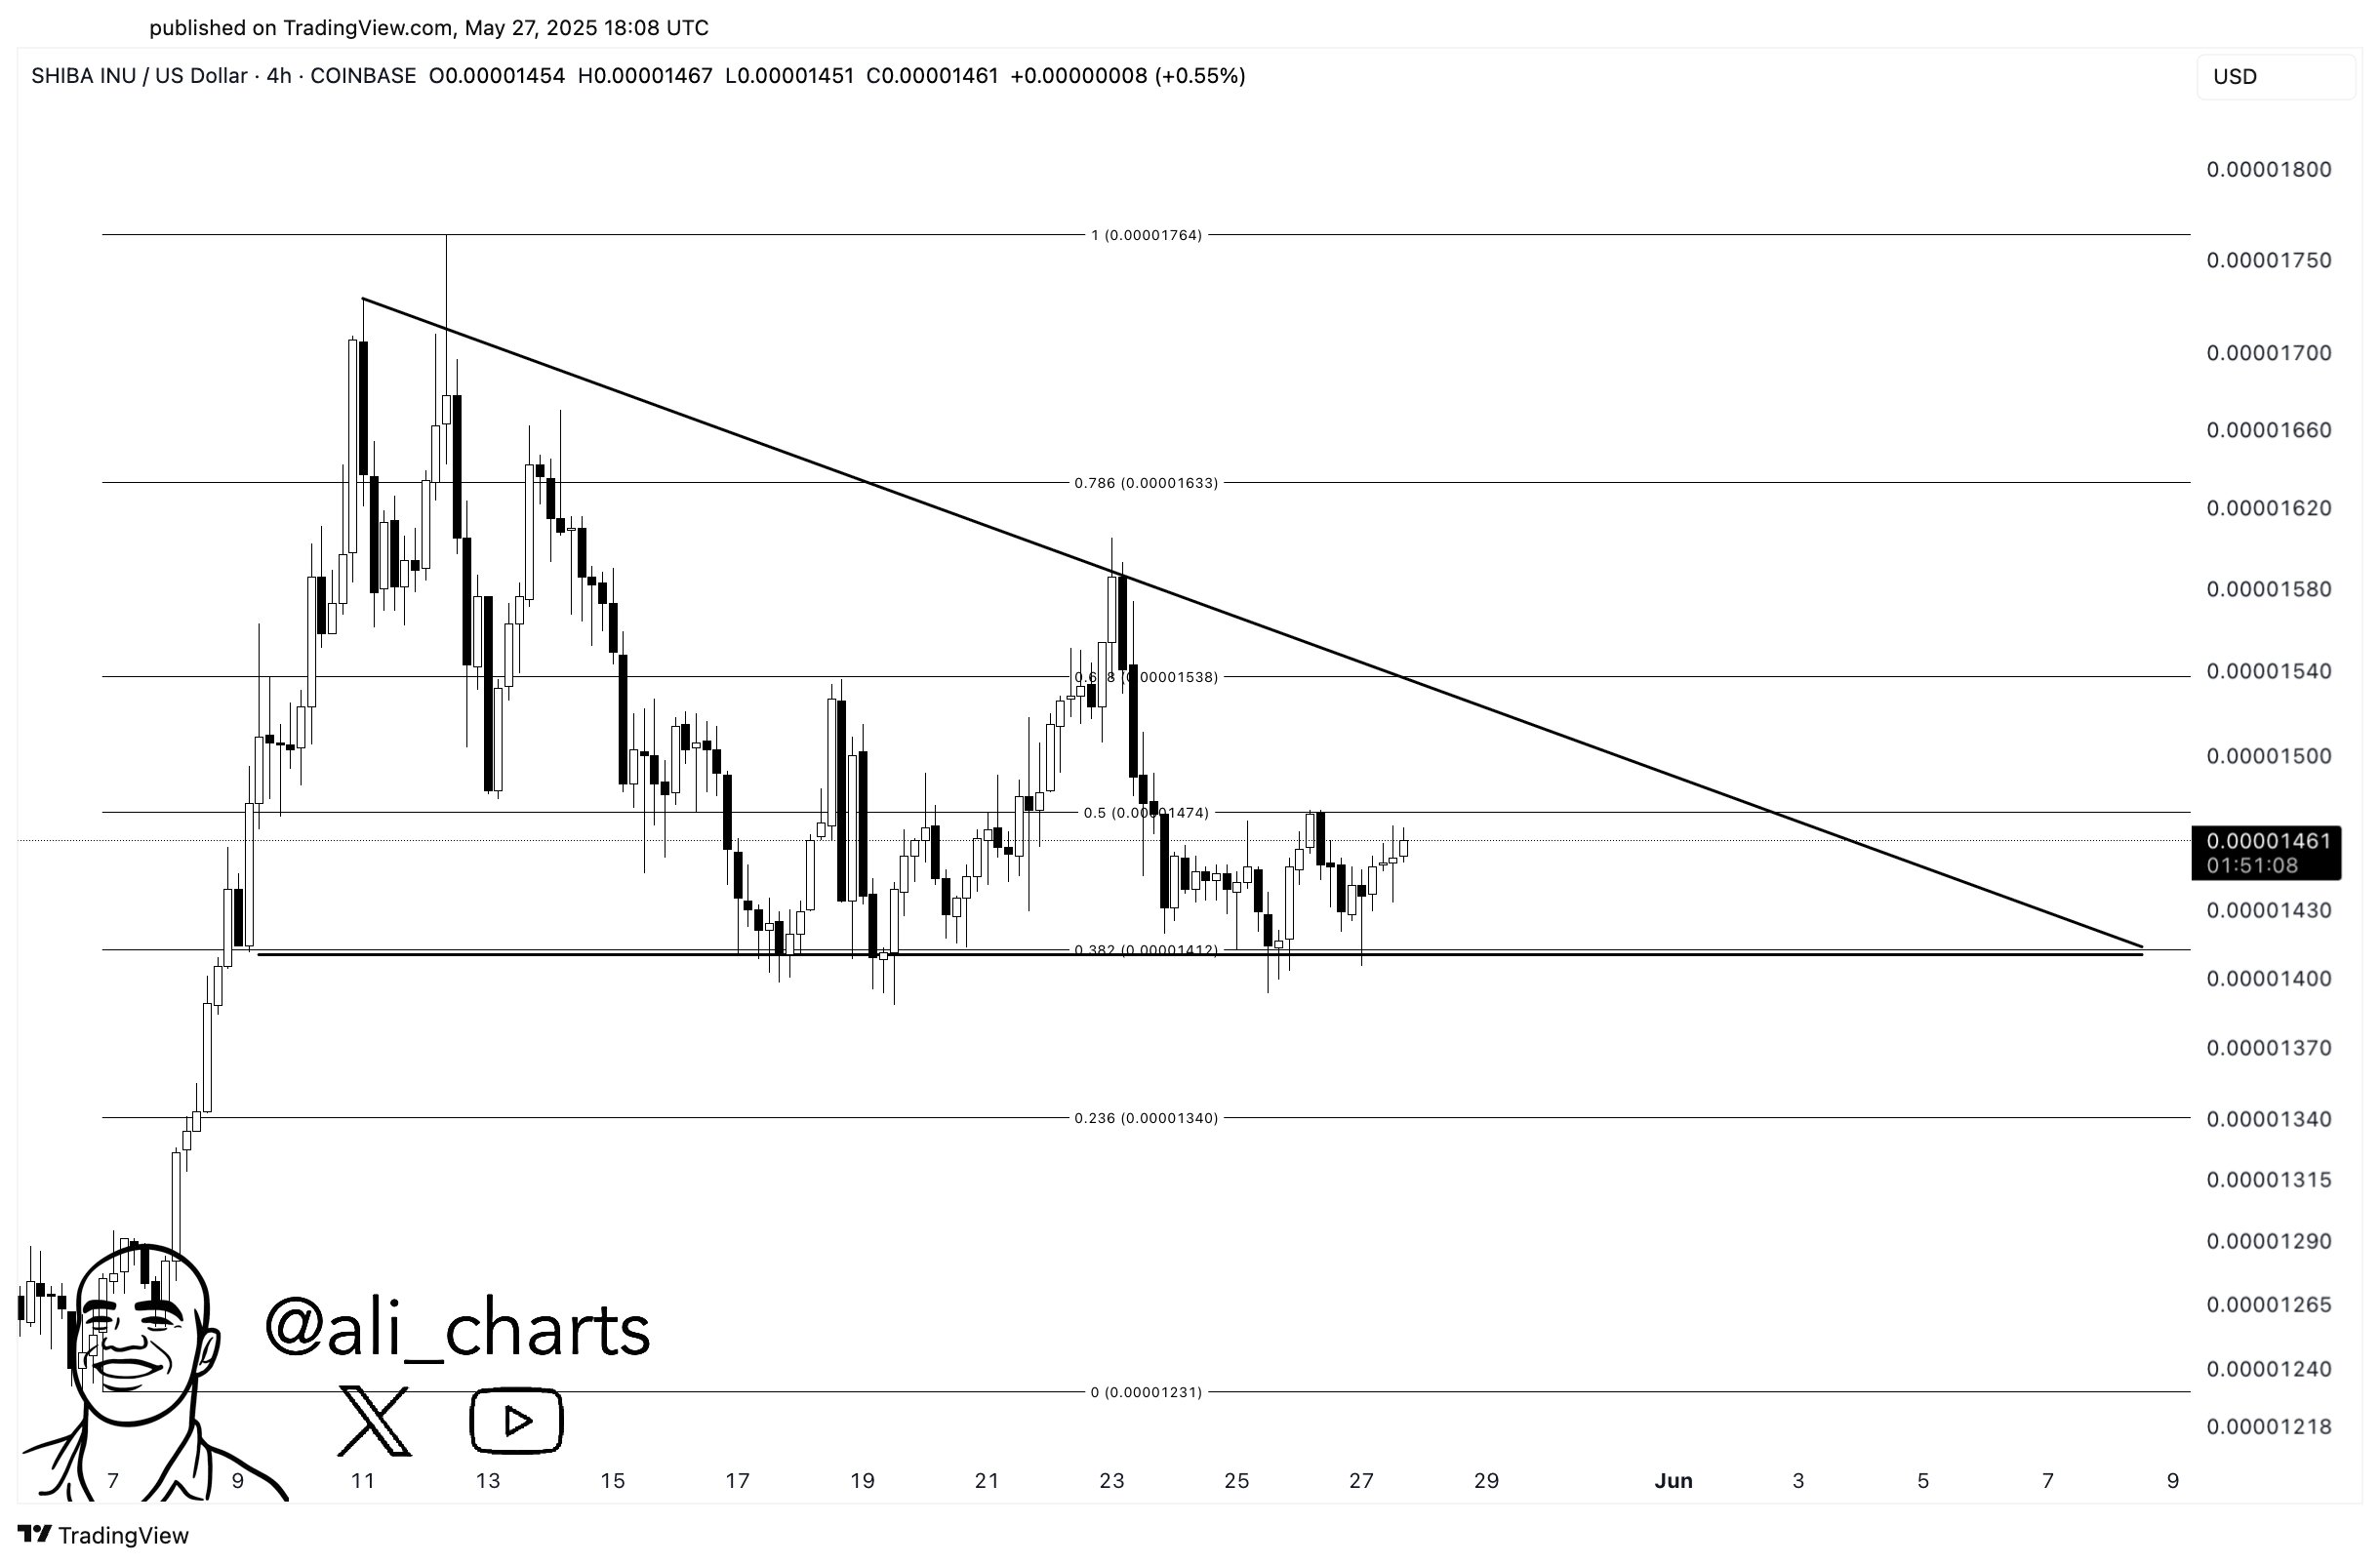
Shiba Inu Trading Within Triangle Pattern Could Signal 17% Move
An analyst indicates that Shiba Inu is forming a triangle pattern on its 4-hour chart, potentially leading to a 17% price movement.
Key Points
- The pattern observed is a descending triangle, with price moving downwards.
- In technical analysis (TA), triangle patterns indicate consolidation between two converging trendlines.
- A breakout from the triangle can extend approximately equal to the height of the triangle.
- Descending triangles typically suggest continuation of a bearish trend but may also reverse upward.
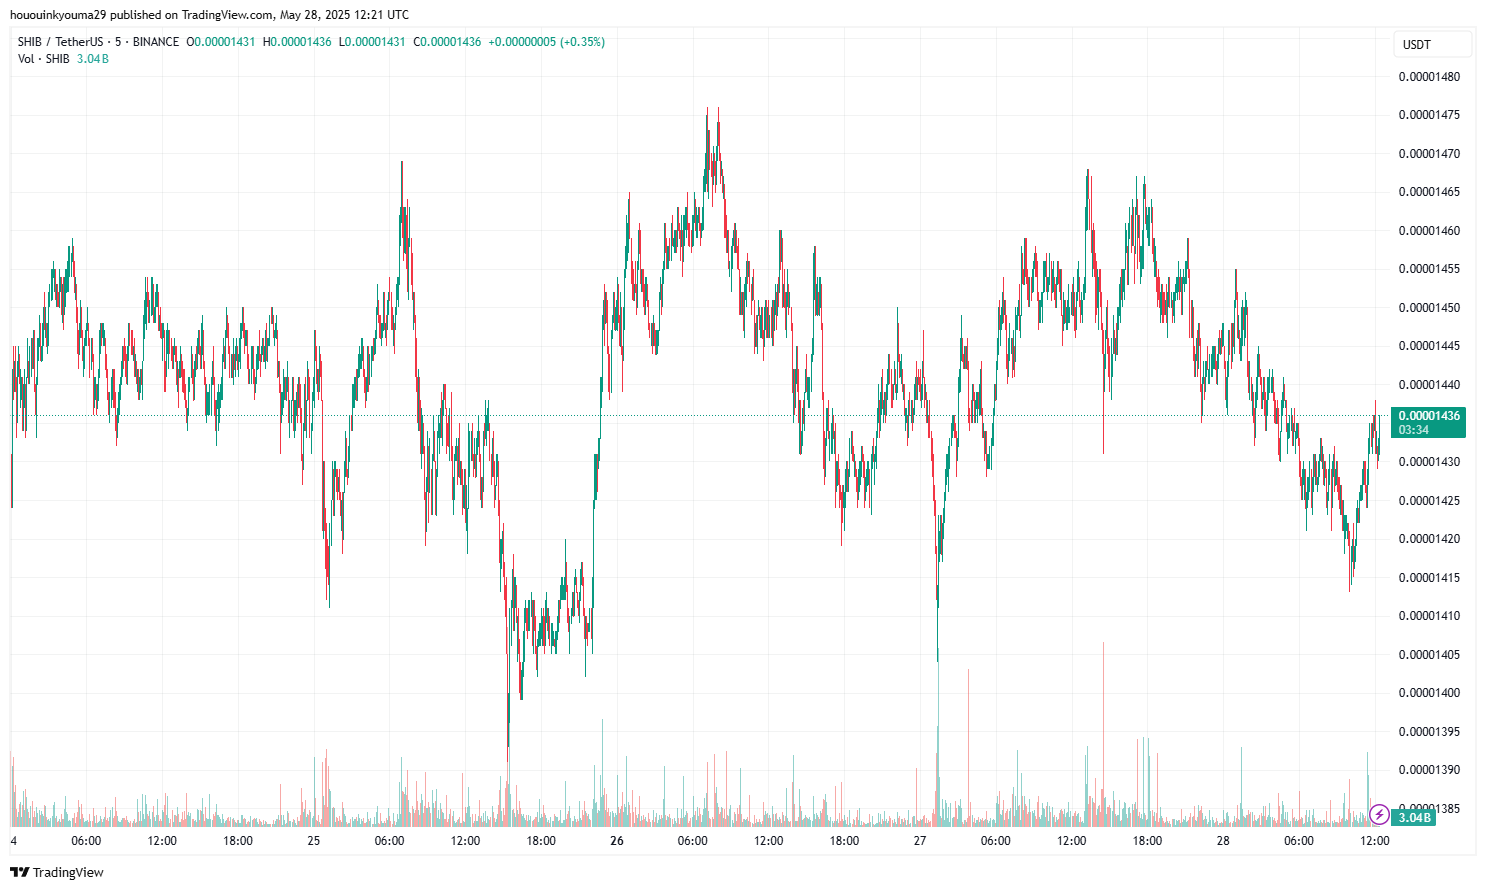
- Shiba Inu's current trading price is around $0.00001436, reflecting a 2% decrease over the past week.