Nov 11, 2025
6 0
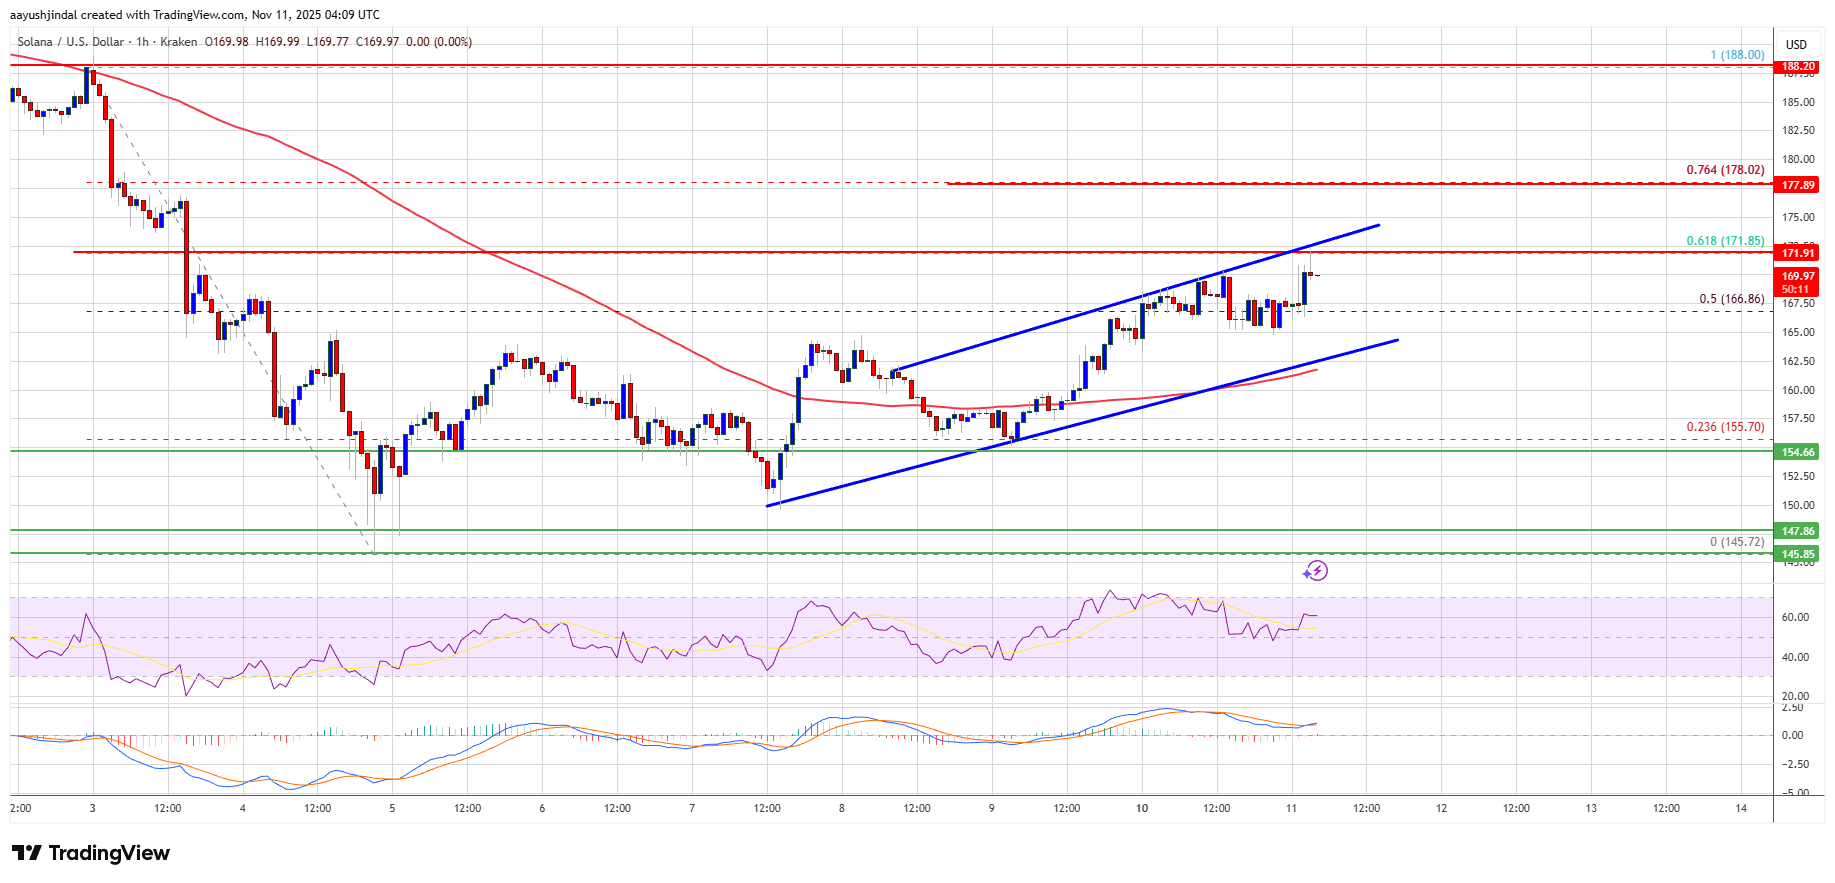
Solana Moves Above $165, Faces Resistance at $172 and $175
Solana Price Movement
- Solana (SOL) is consolidating above $165, trading above the 100-hourly simple moving average.
- A rising channel with resistance at $175 is forming on the hourly SOL/USD chart.
- The price needs to clear $172 and $175 for further upward movement.
Current Resistance and Support Levels
- Immediate resistance is at $172, aligning with the 61.8% Fibonacci retracement of the $188 to $145 move.
- Major resistance levels are at $175 and $188; surpassing these could lead to targets of $202 and $220.
- Support is around $165 and $162; a break below $162 could target $155 or lower to $150.
Technical Indicators
- Hourly MACD: Bullish momentum is increasing.
- Hourly RSI: Above 50, indicating potential bullish strength.
Solana's price trajectory will depend on overcoming key resistance levels. A failure to breach current resistance may result in further declines.