Aug 11, 2025
4 0
Solana Shows Bullish Daily Momentum While Hourly Chart Indicates Weakness
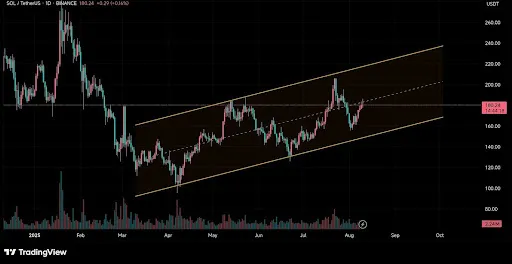
Solana shows a bullish trend on the daily chart, moving within a strong ascending channel. The price is currently approaching the mid-range of this channel, indicating potential upward momentum.
Key Points from the Daily Chart
- Solana is in an ascending channel, reflecting consistent buying interest.
- The next target for bulls is near $220, which acts as a significant resistance zone.
- A pullback below the channel's mid-line could lead to a decline toward the $160 demand zone, crucial for maintaining bullish structure.
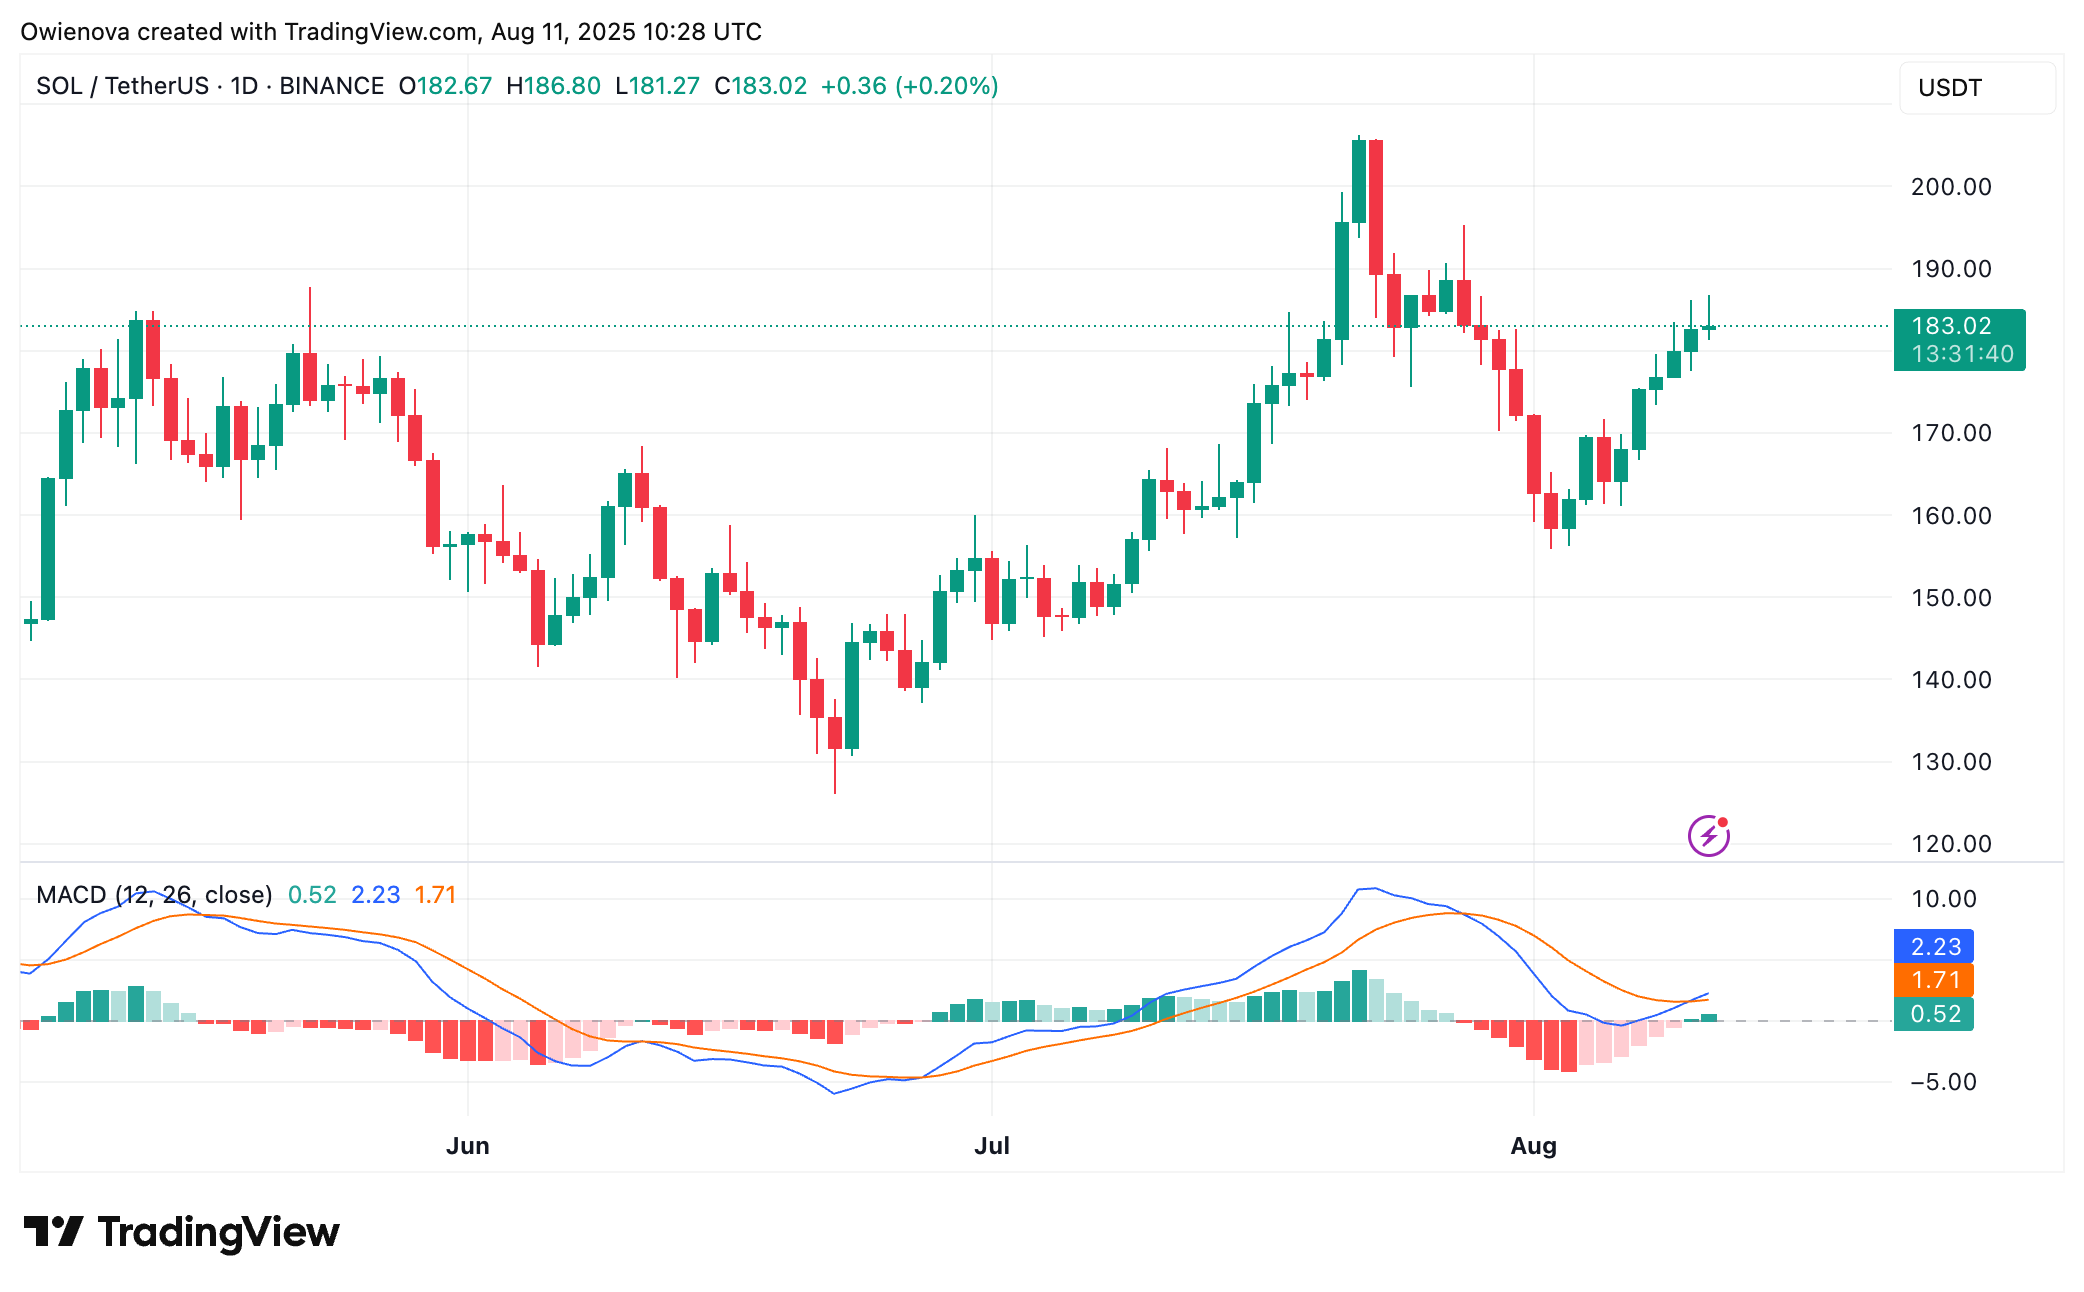
Short-Term Bearish Signals
- Despite the overall bullish structure, short-term indicators show bearish signs on the hourly chart.
- Price action is trading below key moving averages (5, 10, and 20 periods), indicating selling pressure.
- The MACD has crossed below its signal line, suggesting renewed downside momentum.
- The RSI is trending towards oversold territory, indicating weakened buying pressure.
- Support is positioned around $175, while immediate resistance is near $180; a break above could lead to further upside.